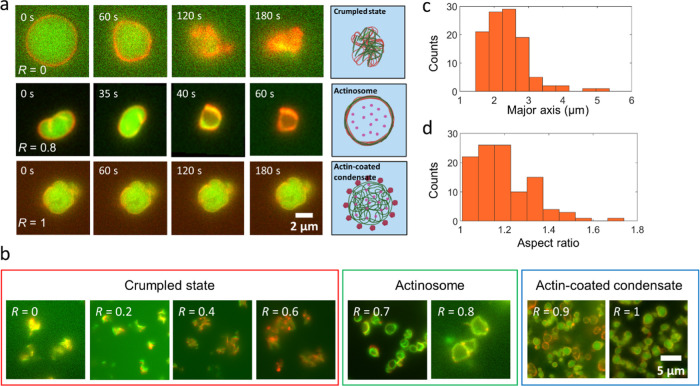
Figure 2.
Actinosome formation depends on the ratio of NTPs present in the condensates. (a) Time-lapse images showing the actin-condensate dynamics at different R (=[GTP]/([GTP] + [ATP])) values. Low R values result in completely crumpled structures, intermediate values form cell-sized actinosomes, while higher R values result in stable actin-coated condensates. The inhomogeneous distribution of the actin signal on the actinosome surface is probably due to varying degrees of local actin polymerization. (b) Representative fluorescence images showing three key types of structures formed over the entire range of R. Actinosomes are obtained only within a narrow range (0.7 ≤ R ≤ 0.8). Lower values (R ≤ 0.6) result in crumpled structures, while higher values (R ≥ 0.9) lack enough ATP and form stable actin-coated condensates. (c) Frequency histogram showing the size distribution of actinosomes, with a mean size (major axis) of 2.4 ± 0.6 μm (n = 107). (d) Frequency histogram showing the ratio of the major axis to the minor axis; the mean value of 1.2 ± 0.1 suggests that actinosomes tend to attain a roughly spherical morphology (n = 107). Images were acquired in epifluorescence microscopy.

