
Fig. 9.
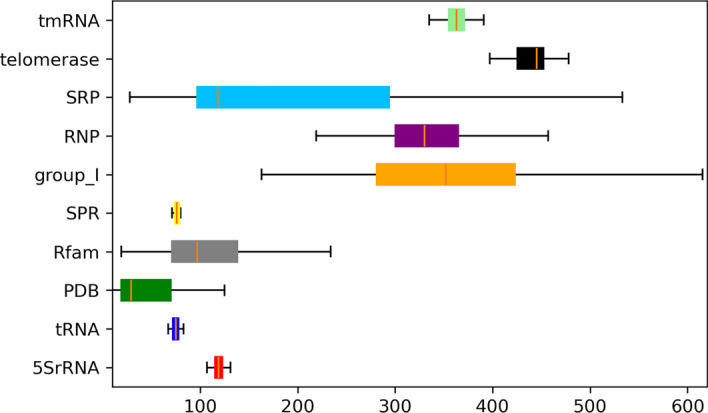
Length profiles of different sequences. The vertical axis of the box chart is the name of the database, and the horizontal axis is the sequence length, and the orange line on the box represents the median
Official websites use .gov
A
.gov website belongs to an official
government organization in the United States.
Secure .gov websites use HTTPS
A lock (
) or https:// means you've safely
connected to the .gov website. Share sensitive
information only on official, secure websites.
Length profiles of different sequences. The vertical axis of the box chart is the name of the database, and the horizontal axis is the sequence length, and the orange line on the box represents the median