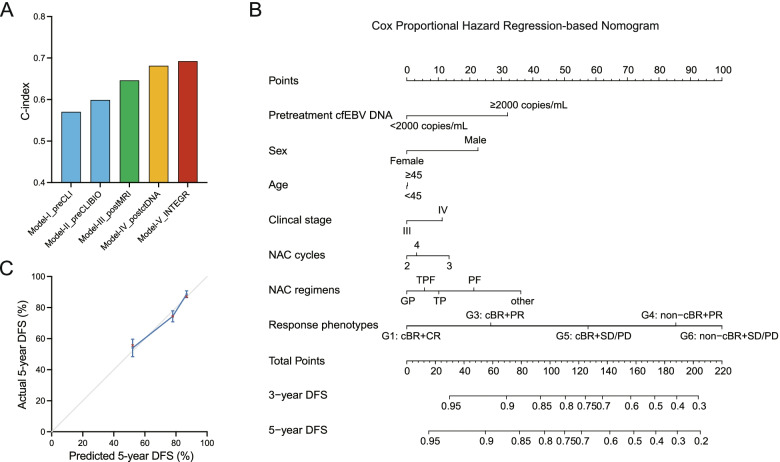
Fig. 4.
The combinations of biological and radiological responses refine risk groupings. A Bar plot showing the C-index and 95% CI for predicting the 5-year DFS by five models incorporating pretreatment risk factors with/without ctDNA and on-treatment parameters using the CpH method. B Nomogram for predicting the 3- and 5-year DFS, which integrated conventional pretreatment risk factors with pretreatment ctDNA, radiological and ctDNA-based response phenotypes, and therapeutic information. The total point values were independently calculated and then applied to the corresponding probability scale. C Calibration plots showing the actual risk probability by decile (y-axis) over the nomogram-predicted risk probability (x-axis). Abbreviations: cBR, complete biological response; cfEBV DNA, cell-free Epstein-Barr virus DNA; CR, complete response; DFS, disease-free survival; non-cBR, non-complete biological response; PD, progression disease; PR, partial responses; SD, stable disease

