Figure 2.
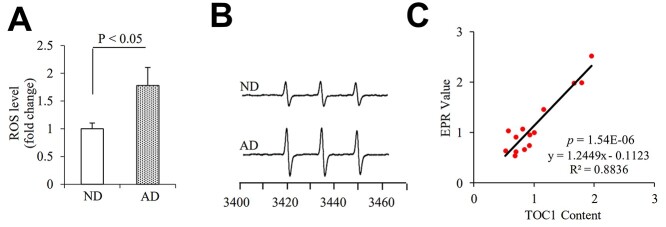
Tau oligomers associate with ROS levels in human AD hippocampus. Quantification of EPR (A) and representative spectra of EPR spectra (B) in the indicated hippocampal homogenous. The peak height in the spectrum indicates levels of ROS. n = 7 per group. (C) Correlation analysis of the relationship between tau oligomer accumulation based on the intensity of immunoreactive oTau dot bots and ROS levels quantified by EPR on hippocampus. n = 14 for the correlation analysis.

