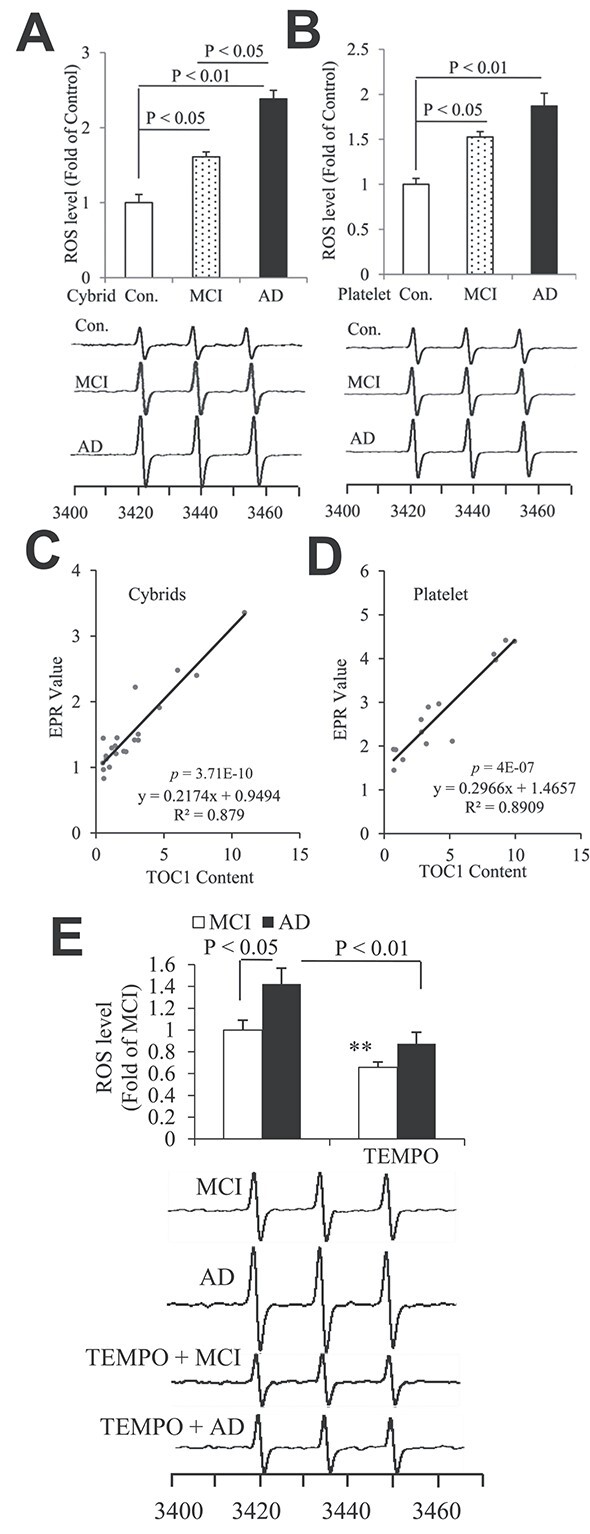
Figure 7.

Tau oligomers associate with ROS levels in differentiated AD and MCI trans-mitochondrial cybrid cells and human platelets. Quantifications of EPR spectra and representative spectra of EPR in the indicated cybrids (A) and platelets (B). The peak height in the spectrum indicates levels of ROS. n = 5 for cybrids and 7 for platelets per group. (C, D) Correlation analysis of the relationship between Tau oligomers based on the quantification of immunodot blots for TOC1 and ROS levels on cybrids (C) and platelets (D). n = 15 for cybrids and 21 for platelets for the correlation analysis. (E) The bar graph presents quantification of immunodot blotting for TOC1 normalized to β-actin on differentiated MCI and AD trans-mitochondrial cybrid cells with or without mito-TEMPO treatment. The representative immunodot blottings were shown below for TOC1 from indicated cybrids and β-actin served as a loading control. n = 5 for cybrids per group.
