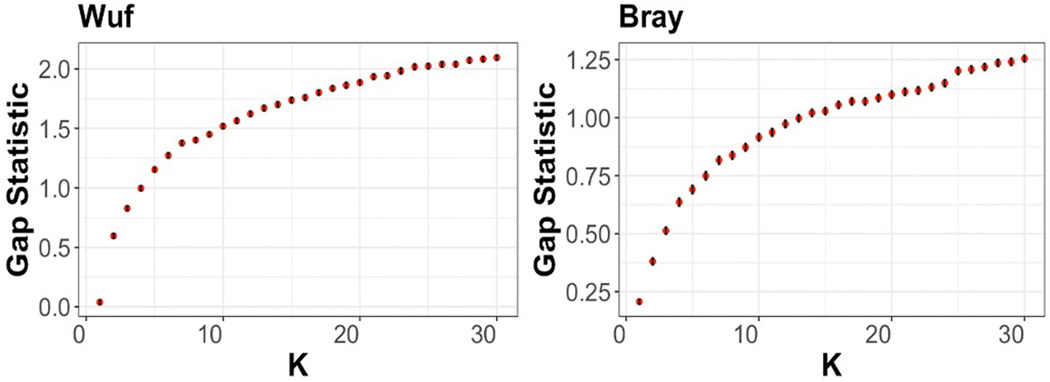
Extended Data Fig. 6 |. Evaluation of the robustness of cluster formation.
Weighted UniFrac (Wuf) and Bray-Curtis (Bray) distances were computed prior to partition around medoids analysis. The gap statistic (y-axis) is plotted as a function of K (x-axis), defined as the number of clusters evaluated. The error bars correspond to the confidence interval generated on 1000 bootstraps. The optimal number of clusters corresponds to K where additional clusters fail to increase the gap statistic using both a phylogenetically aware distance metric (UniFrac) and Bray Curtis.

