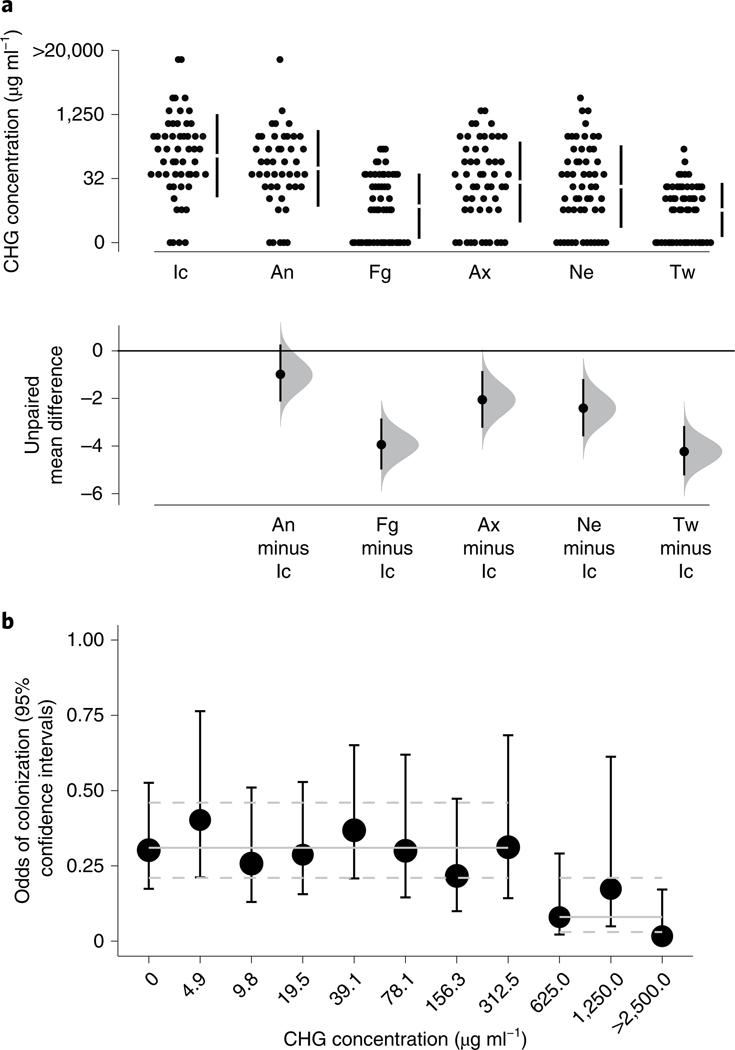
Fig. 2 |. High concentrations of CHG are needed to reduce the odds of C. auris colonization.
a, Gardner–Altman estimation plot comparing the mean difference in CHG concentrations (µg ml−1) across body sites. Top, raw data are shown as a scatterplot of CHG concentration plotted as a function of body site for the first survey (54 residents, n = 319). Bottom, data are presented as the mean difference between CHG concentration (µg ml−1) at each body site and the inguinal crease, the site reaching the highest average CHG concentration, ±95% confidence intervals. Histograms reflect the sampling distribution from a nonparametric bootstrap. b, Each point represents the modeled odds of C. auris colonization (±95% confidence intervals) plotted against the measured skin CHG concentration (µg ml−1), adjusted for multiple measurements within resident and over time. The solid horizontal lines represent odds of colonization per respective group (that is, <625 µg ml−1 versus ≥625 µg ml−1), while the dashed lines encompass the 95% confidence interval surrounding each group estimate. Significance tests were based on the model-estimated log odds divided by the standard error, distributed as a t distribution.

