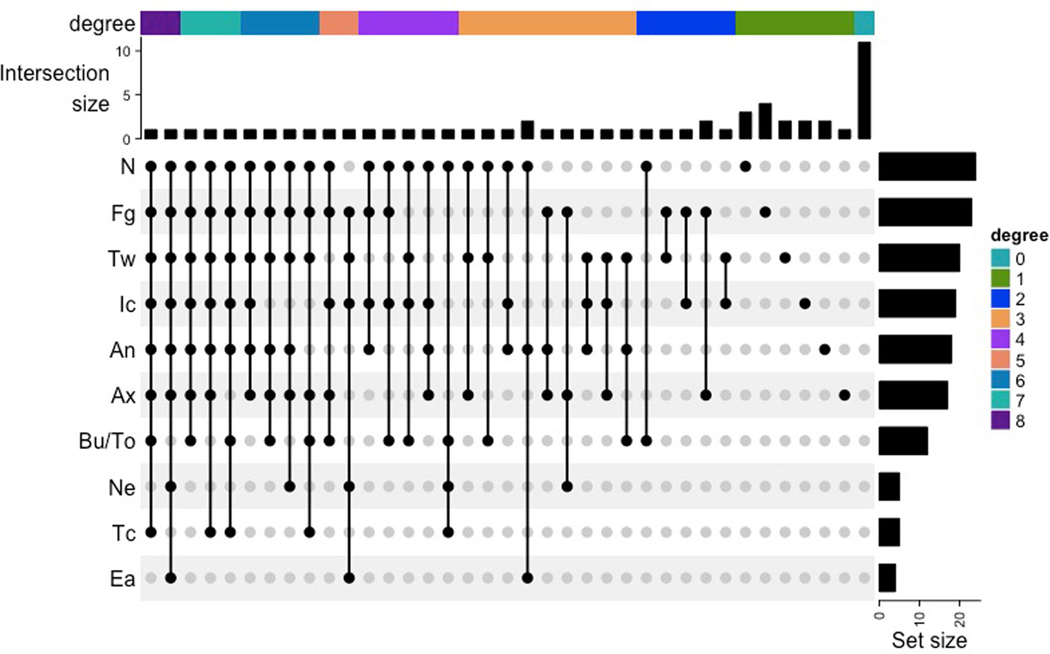
Extended Data Fig. 2 |. Patterns of body site colonization visualized with UpSetR.
Colors map to degree, a measure of the number of co-colonized sizes. A total of 36 distinct co-colonization patterns were observed, each arranged from the left to the right as a function of decreasing degree. The intersection size is the number of subjects whose body-site colonization matches the points connecting sites for each of the 36 unique co-colonization patterns. For example, the nares (N) and fingertips/palm (Fg) are more frequently mono-colonized than any of the other sites while the buccal mucosa/tongue (Bu/To), neck (Ne), tracheostomy site (Tc), and external auditory canal (Ea) are never mono-colonized. Most patients have a distinct pattern of co-colonization with the most frequent pattern being singular colonization of the nares (N) or fingertips/palm (Fg). The set size corresponds to the frequency of colonization for each site for the first time point.

