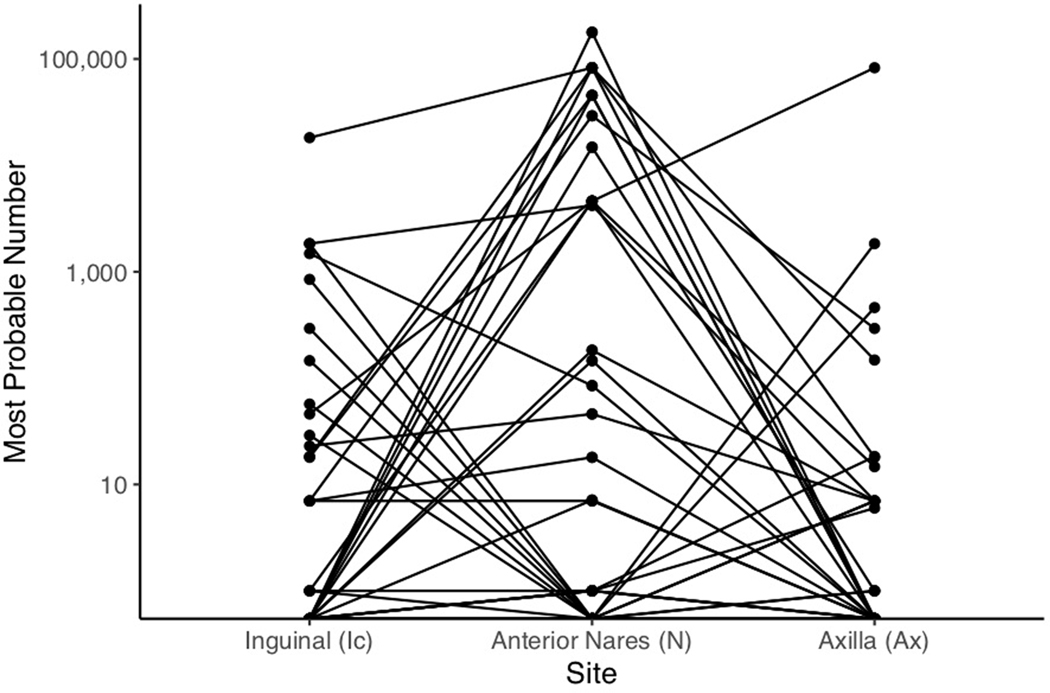
Extended Data Fig. 4 |. Paired Most Probable Number (MPN) Analysis.
MPN estimates are shown for the inguinal crease, anterior nares, and axilla. Data represented are from the first point prevalence survey. Each line represents an individual. Individual trajectories reveal a large number of individuals with high counts at the nares and either absent or low-level colonization at the axilla or inguinal crease.

