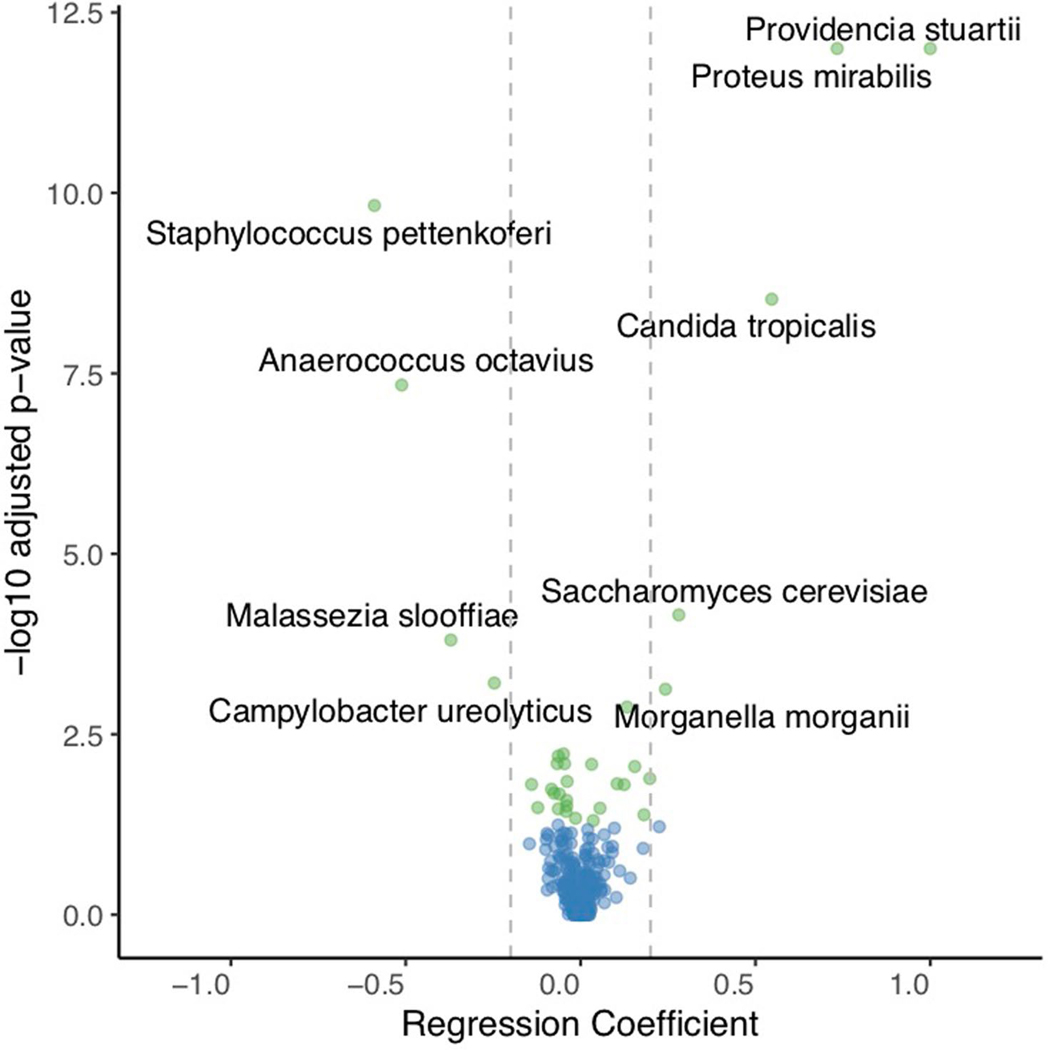
Extended Data Fig. 5 |. Volcano plot of statistical significance (-Log adjusted p-value) against the regression coefficients from linear mixed effects models.
Each point represents a regression coefficient for a bacterial or fungal species. The vertical lines demarcate regression coefficients of −0.2 and 0.2. Species having Holm adjusted p-values < 0.05 are highlighted in green while non-significant taxa are in blue. Species exhibiting a positive association with CHG concentration (skin concentrations (estimate > 0.2, Holm adjusted p < 0.05) include Providencia stuartii, Proteus mirabilis, Candida tropicalis, Saccharomyces cerevisiae and Morganella morganii. Species exhibiting a negative correlation with CHG skin concentrations (estimate < −0.2, Holm adjusted p < 0.05) include Staphylococcus pettenkoferi, Anaerococcus octavius, Malassezia slooffiae, and Campylobacter ureolyticus.

