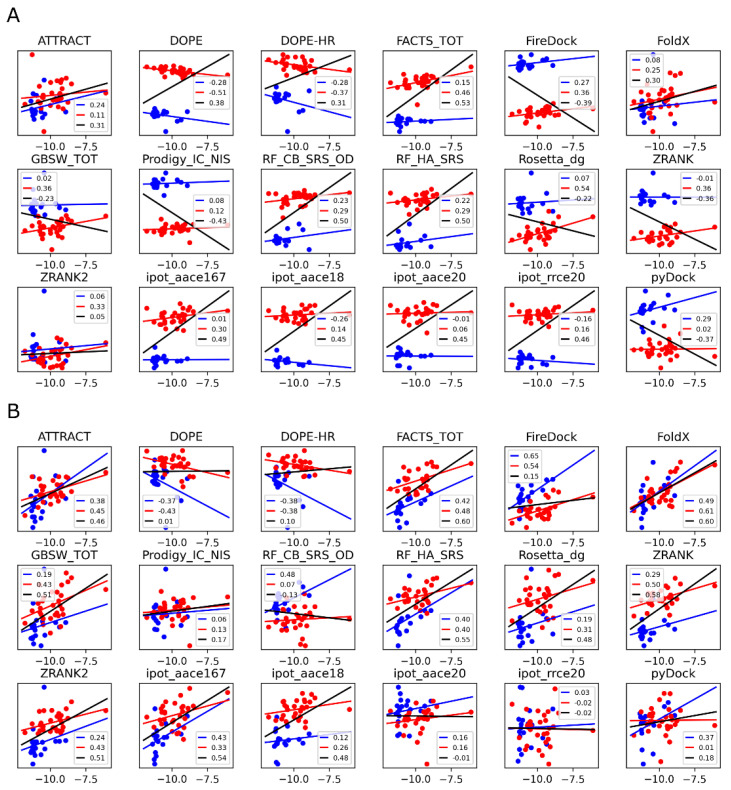
Figure 5.
Correlations between the experimental and computed binding affinities using the 18 quick scoring functions. (A): the structures were generated using Modeller; (B): the structures were generated using Rosetta. Data for the complexes with the RSC3 antigen are in red, data for the complexes with the 93TH057 antigen are in blue, and the black lines correspond to the overall correlations. The numbers in the legends are the Pearson correlation coefficients.

