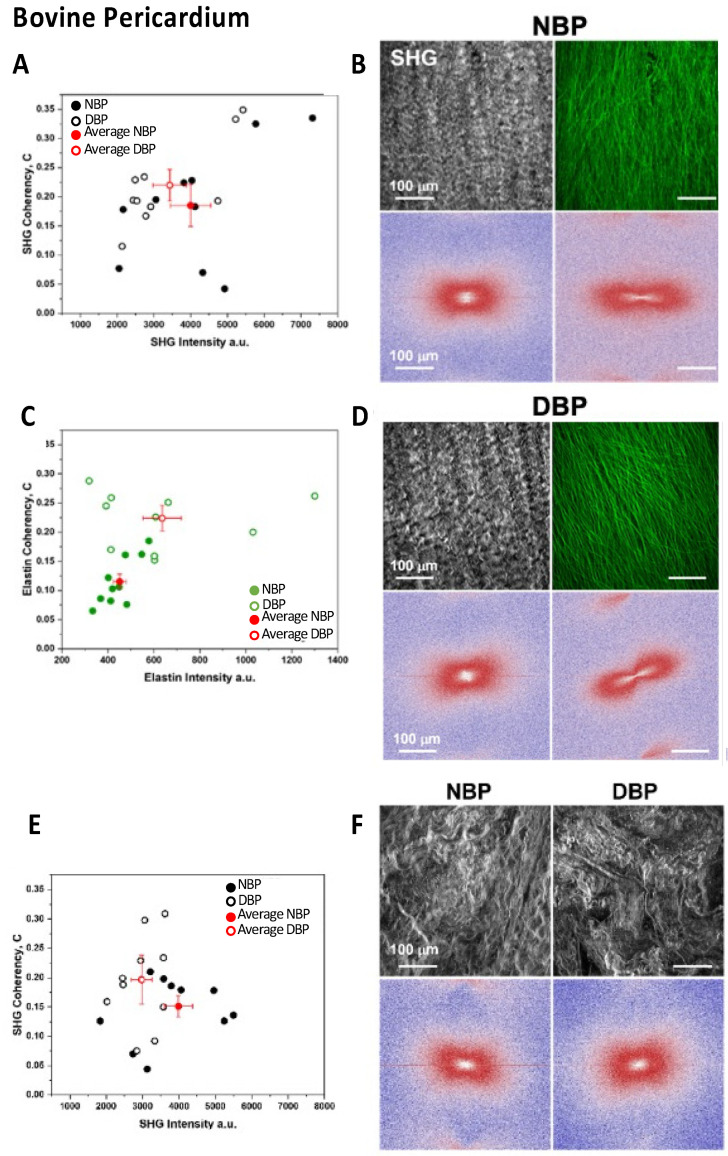
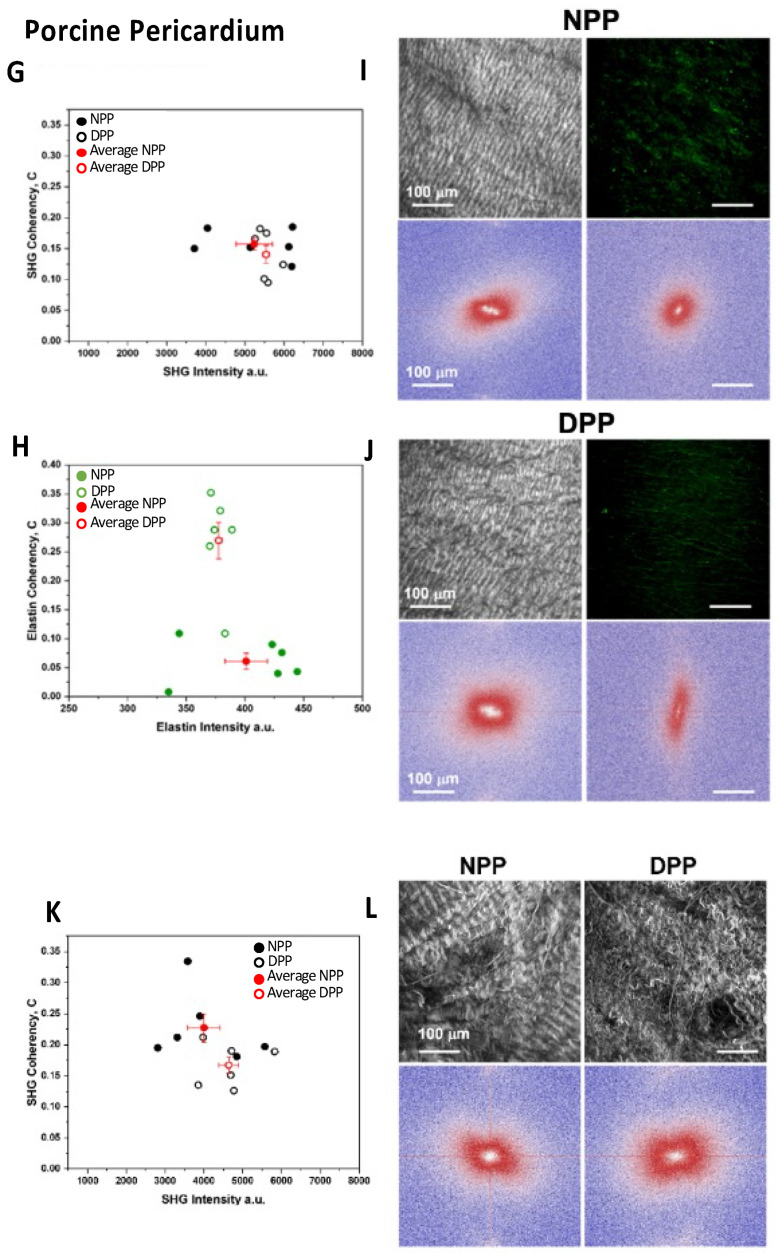
Figure 4.
Two-photon microscopy analyses of the native and decellularized bovine and porcine pericardia. Bovine pericardium: (A) scatter plot of the SHG intensities vs. SHG coherency values; (C) scatter plot of elastin values; (B,D) images of SHG and elastin and corresponding FFT; (E) scatter plot of the SHG intensities vs. SHG coherency values of the serosa side; (F) representative images of SHG and corresponding FFT. Porcine pericardium: (G) scatter plot of the SHG intensities vs. SHG coherency values; (H) scatter plot of elastin values; (I,J) images of SHG and elastin and corresponding FFT; (K) scatter plot of the SHG intensities vs. SHG coherency values of the serosa side; (L) representative images of SHG and the corresponding FFT.


