Figure 4.
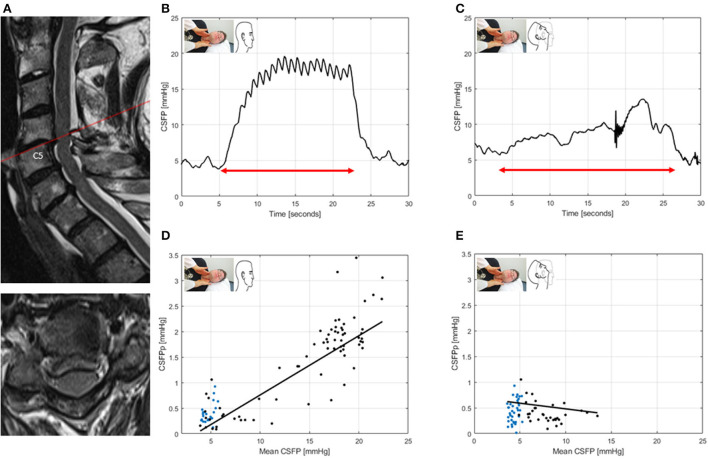
T2-weighted MRI of the cervical spine for ID2 (patient with degenerative cervical myelopathy, mJOA: 17) (A). Sagittal and axial images showing spinal canal stenosis maximum at level C4/5, without clear cord compression. CSFP is shown during the Queckenstedt's test in neutral head position (rise, 15.2 mmHg) (B), which declines in head reclination (rise, 7.2 mmHg) (C). Cardiac-driven CSFP peak-to-trough amplitude (CSFPp) at resting state (blue dots) and during the Queckenstedt's test (black dots) is plotted against mean CSFP (D). The regression line (in black) is reported as relative pulse pressure coefficient (RPPC-Q). In neutral head position, RPPC-Q is 0.12 (D), and, in head reclination, it declines to −0.02 (E).

