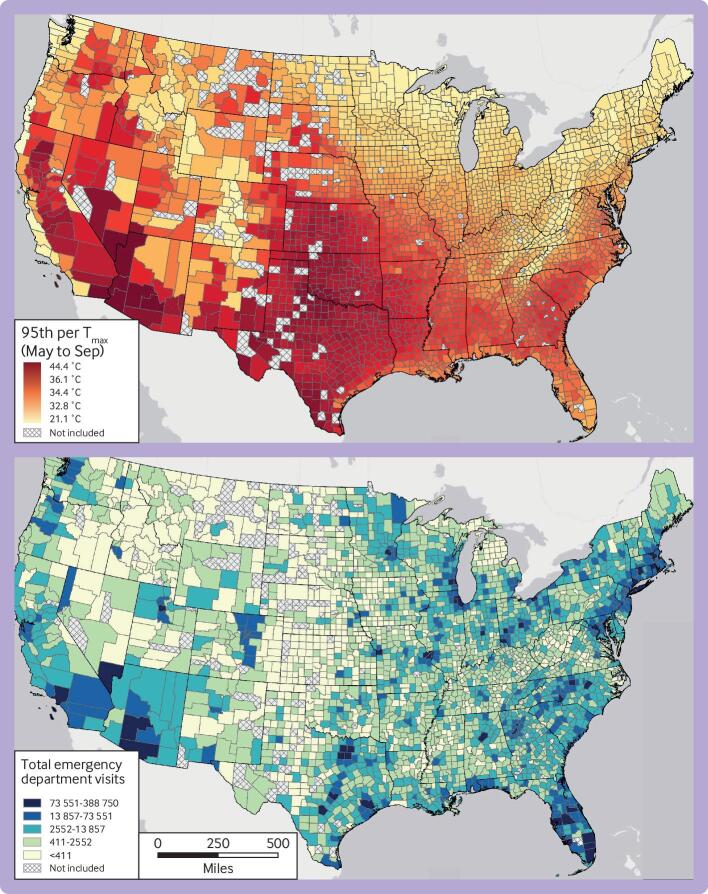
Fig 1.
Maps of extreme temperature and number of emergency department visits between May and September 2010-19. (Top panel) Warm season average daily maximum ambient temperature at 95th centile. (Bottom panel) Number of emergency department visits. Counties in gray were not included in the analysis because no emergency department visits were recorded during the study period

