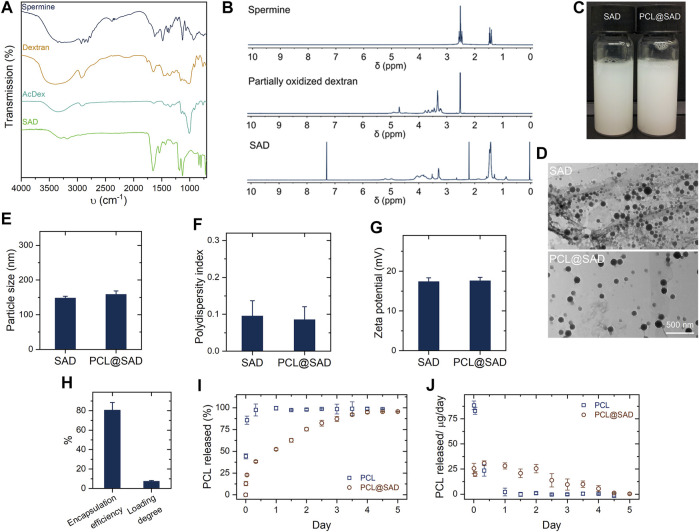
FIGURE 1.
Characterization of SAD nanoparticles. (A,B) The Fourier transform infrared (A) and nuclear magnetic resonance (B) spectra of dextran and SAD. (C,D) Representative photos (C) and transmission electron microscopy images (D) of bare SAD nanoparticles and PCL@SAD nanoparticles. (E–G) Average particle size (E), polydispersity index (F), and zeta potential (G) of the engineered nanoparticles (n = 3). (H) Encapsulation efficiency and loading degree of PCL in SAD nanoparticles (n = 3). (I,J) Cumulative PCL release profiles (I) and daily amount of PCL released (J) from PCL and PCL@SAD (n = 3).

