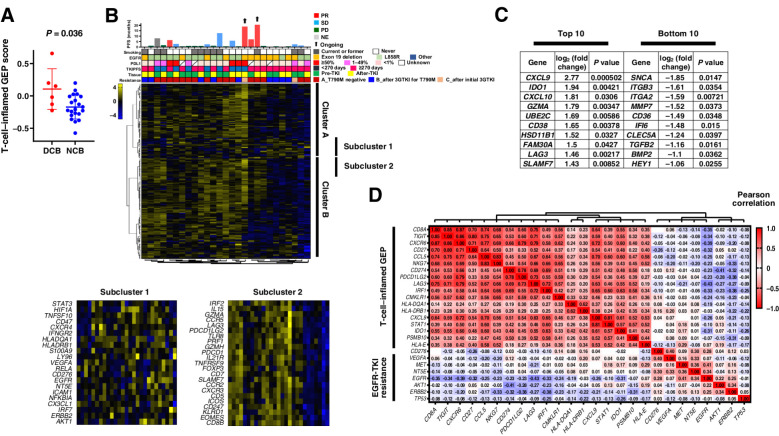
Figure 4.
Immune-related gene expression analysis of tumor specimens. A, Dot plots for the T-cell–inflamed gene expression profile (GEP) score according to nivolumab efficacy for 27 patients. The mean and standard error of the mean values are also shown, and the P value was determined with the Mann-Whitney test. DCB, durable clinical benefit, defined as a partial response or stable disease lasting >6 months; NCB, no clinical benefit. B, Heat map of immune-related gene expression for 27 patients treated with nivolumab (middle panel). Hierarchical clustering of the 27 tumors was performed according to the expression of 183 selected immune-related genes. A dendrogram was generated by clustering, resulting in the identification of several clusters, with two main clusters being designated A and B. The details of two representative subclusters (subclusters 1 and 2) of these two clusters are shown expanded in the bottom panels because of their potential importance for a biological explanation of nivolumab efficacy based on their constituent genes. The color scale represents the Z score for the expression of each individual gene, with the highest expression shown in yellow, medium in black, and lowest in blue. Progression-free survival (PFS) and best objective response for nivolumab as well as other patient characteristics are presented in the top panel as in Fig. 3. C, Lists of the top 10 and bottom 10 genes whose expression was associated with PFS for nivolumab as revealed by comparison of single-gene expression between DCB and NCB groups (Supplementary Fig. S12). D, Correlation between expression of the 18 genes constituting the T-cell–inflamed GEP and that of genes related to epidermal growth factor receptor (EGFR) tyrosine kinase inhibitor (TKI) resistance in 55 patients of the current trial. The color scale indicates Pearson correlation coefficient.

