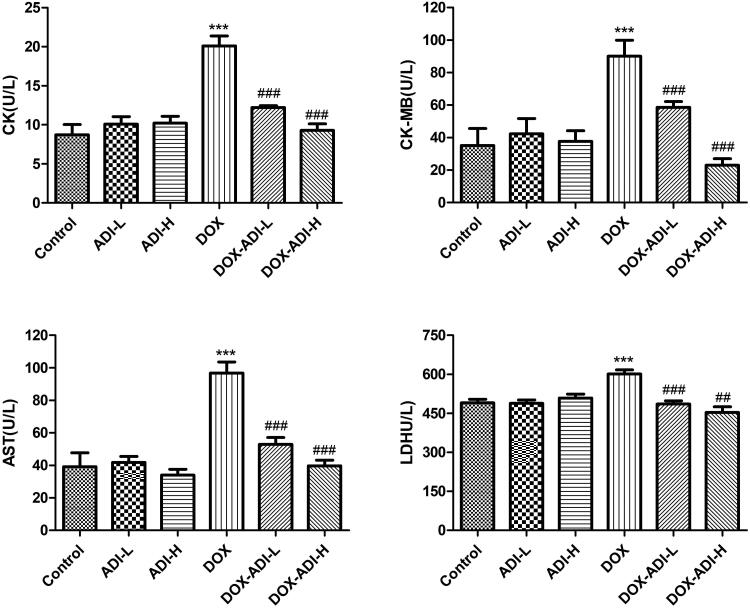
Figure 3.
The concentrations of CK, CK-MB, AST and LDH in the serum of mice treated with DOX (0.03 mg/10 g) and/or ADI (0.1 and 0.2 mL/10 g). Data are presented as mean ± SD (n = 6). *P < 0.05, ***P < 0.001 vs. control group without DOX treatment; #P < 0.05, ##P < 0.01, ###P < 0.001 vs. control group with DOX treatment.

