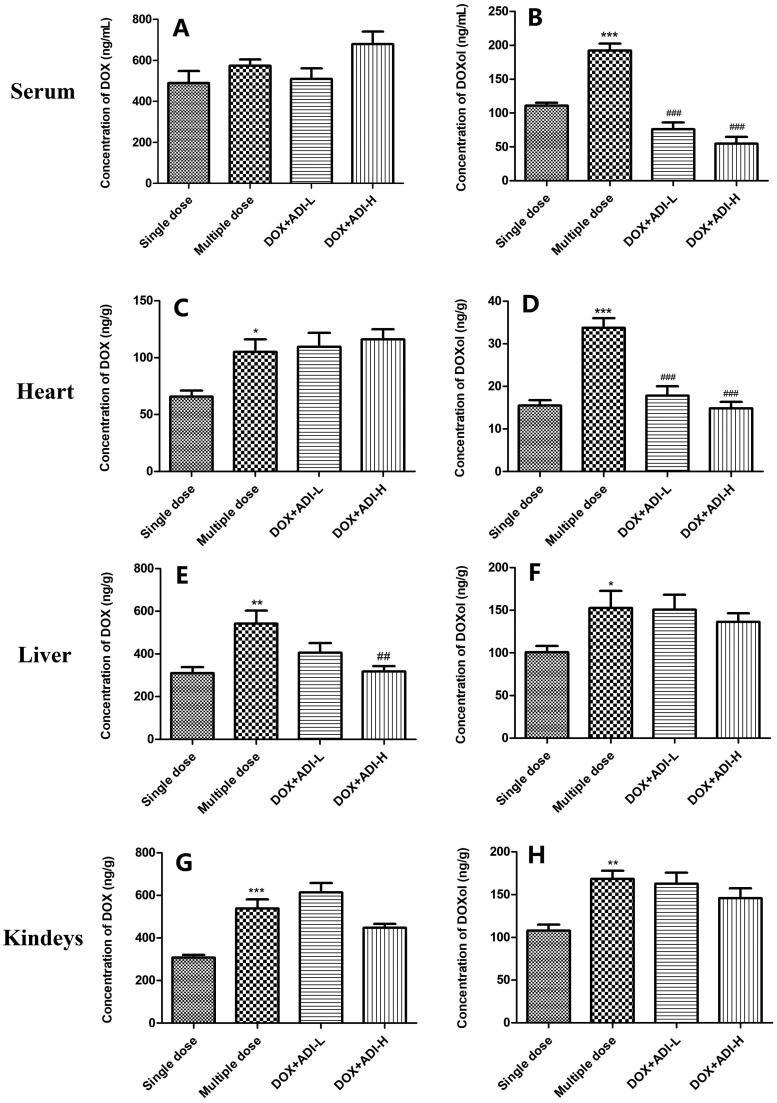
Figure 5.
Concentrations of DOX and DOXol in the serum, heart, liver, and kidneys of mice treated with DOX alone or combined with ADI. DOX (A) and DOXol (B) concentrations in mice serum. DOX (C) and DOXol (D) concentrations in heart. DOX (E) and DOXol (F) concentrations in liver. DOX (G) and DOXol (H) concentrations in kidneys. Values are presented as mean ± SD (n = 6). *P < 0.05, **P < 0.01, ***P < 0.001 vs. single-dose administration of DOX; ##P < 0.01, ###P < 0.001 vs. multiple-dose administration of DOX.

