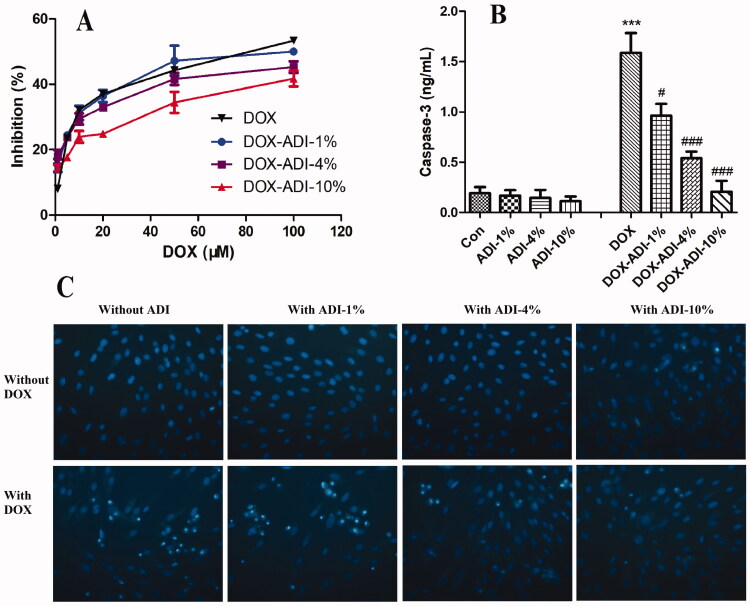
Figure 6.
The protective effects of ADI on DOX-induced cytotoxicity in H9c2 cells. (A) Logarithmic plots of the inhibition curves obtained after treating the cells with DOX (1, 5, 10, 20, 50 and 100 μM) in the presence or absence of ADI (1, 4, 10%). (B) Effect of ADI on caspase-3 activity induced by DOX (5 μM) in H9c2 cells. (C) Representative fluorescence images of Hoechst 33342 staining of H9c2 cells after different treatments. Magnification: 200× Values are expressed as mean ± SD from six independent experiments. **P < 0.01, ***P < 0.001 vs. control group without DOX, ###P < 0.001 vs. control group with DOX.

