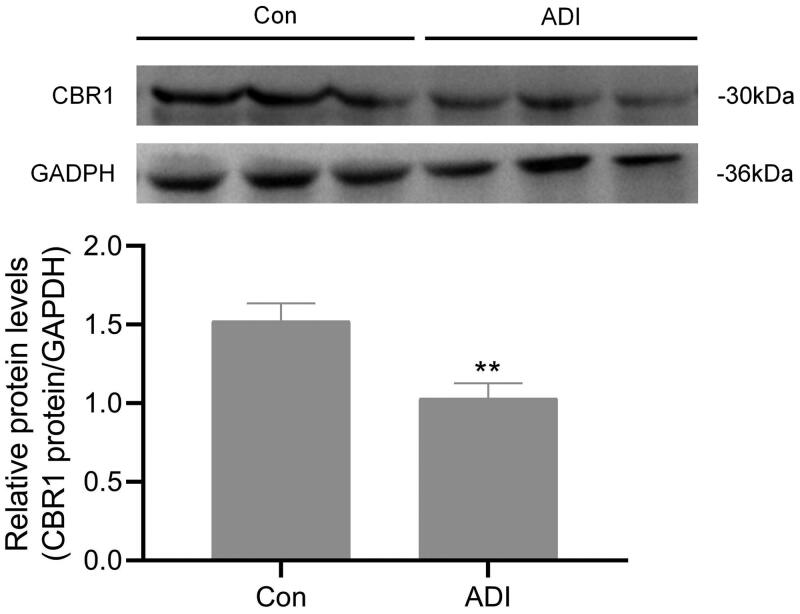
Figure 8.
Effects of ADI on the expression of CBR1 in H9c2 cells. H9c2 cells were incubated with ADI (10%) or an equivalent volume of PBS for 18 h. CBR1 protein levels was determined by western blot analysis. (A) Representive images of CBR1 expression detected by Western blotting. (B) Protein ratios normalised to GAPDH used to quantify fold change by densitometry and shown in a histogram. Data are expressed as mean ± SD of three independent experiments. **P < 0.01 vs. control group at the same time.

