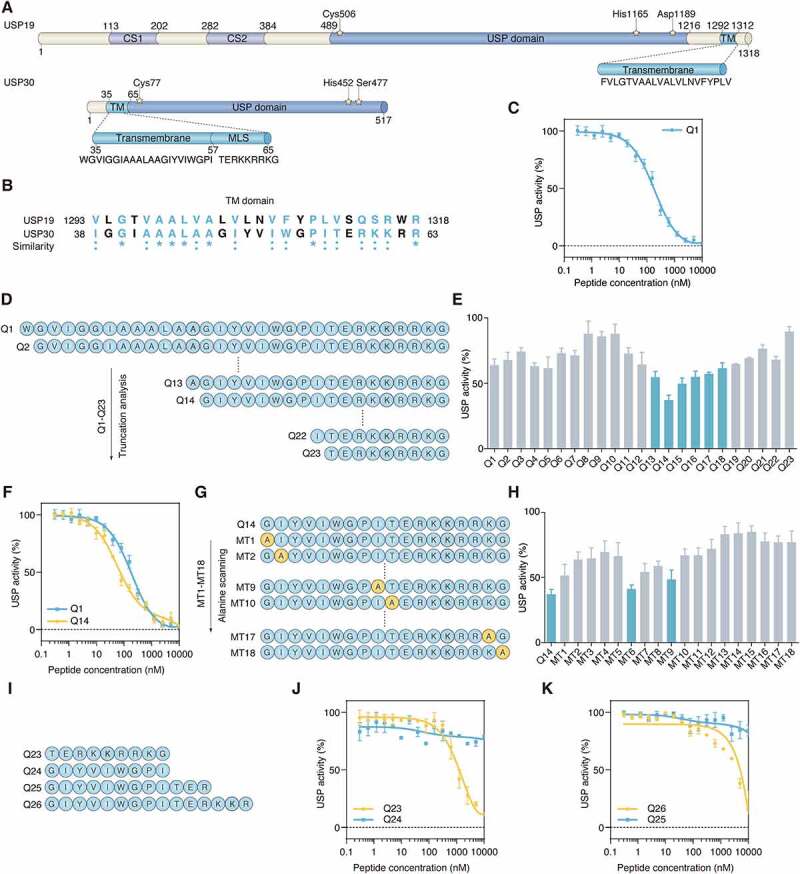
Figure 1.

The TM domain of USP30 inhibits its catalytic activity. (A) Schematic representation of protein domain architecture of USP19 and USP30. The positions of the amino acids Cys, His, Asp and Ser in the catalytic triad are indicated and the sequences of TM domain of USP19 and USP30 are listed. CS, CHORD-containing proteins and SGT1; USP, ubiquitin specific peptidase; TM, transmembrane; MLS, mitochondrial localization sequence. (B) The sequence alignment of TM domains of human USP19 and USP30. The similarity between USP19 and USP30 is represented by symbols at the bottom of the proteins. An “*” (asterisk) or “:” (colon) represents an identical or conserved (i.e., not identical but of the same type) amino acid residue. The GenBank accession numbers are as follows: human USP19, NM_006677; human USP30, NM_032663. (C) Inhibition of USP30 activity was shown as dose-response curves for Q1 peptide. The IC50 value was determined as the concentration of peptide that reduced USP activity by 50%. Data are represented as mean ± s.d. of three independent experiments. (D) The schematic diagram showing the peptide truncation analysis. The peptide truncation generates different lengths of peptide. (E) The comparison of USP30 activity inhibition between different length of peptide under 100 nM concentration. Data are represented as mean ± s.e.m. of three independent experiments. (F) Inhibition of USP30 activity was shown as dose-response curves for Q1and Q14 peptides. Data are represented as mean ± s.d. of three independent experiments. (G) Schematic diagram showing the peptide alanine screening analysis. MT1-MT18 peptide was generated by mutating single amino acid to alanine. (H) The USP30 inhibition activity was compared between alanine mutated peptide with 100 nM concentration. 100% USP activity was normalized to the control treatment. Data are represented as mean ± s.e.m. of three independent experiments. (I) Schematic diagram showing the peptide sequences of Q23, Q24, Q25, Q26. (J) Inhibition of USP30 activity was shown as dose-response curves for Q23, Q24 peptide. The C-terminal of TM domain (Q23 peptide) showed more inhibitory potential than N-terminal of TM domain (Q24 peptide). Data are represented as mean ± s.d. of two independent experiments. (K) The comparison of USP30 activity inhibition between Q25 and Q26 peptide. Q26 peptide have a longer length of the C-terminal part of the TM domain than the Q25 peptide. Data are represented as mean ± s.d. of two independent experiments.
