Figure 4.

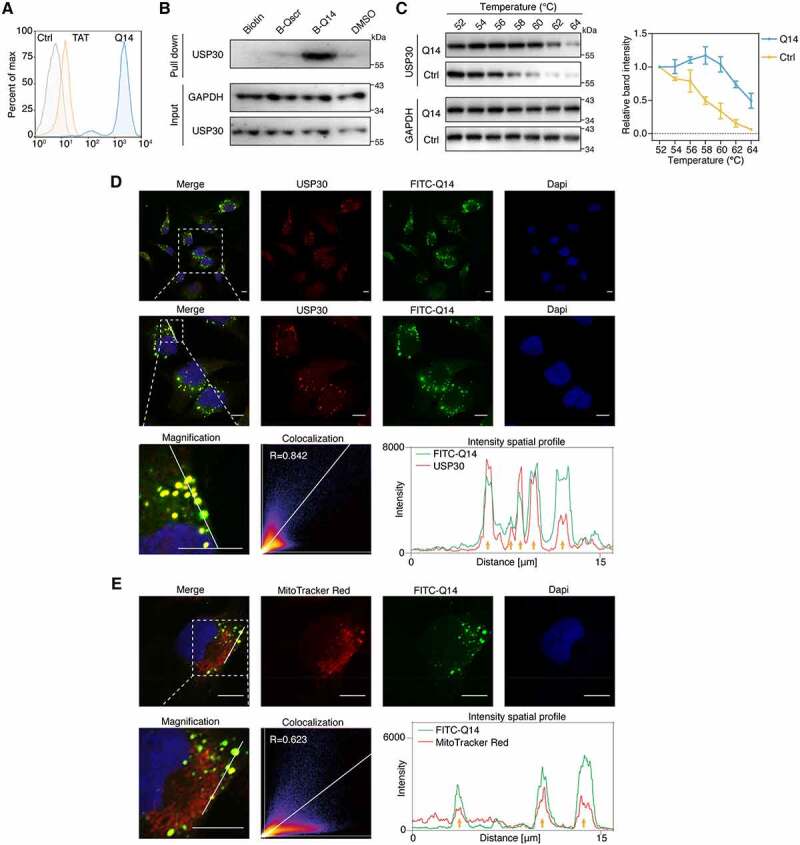
Q14 peptide targets USP30 in cells. (A) FACS analysis illustrates the internalization of FITC-labeled Q14 peptide in A172 cells. Data are representative of two independent experiments. (B) SA-affinity-isolation assay in A172 cells treated with DMSO, biotin, biotin-labeled Q14 peptide (B-Q14, 50 µM) or biotin-labeled scramble peptide (B-Qscr, 50 µM) for 12 h. Western blots from a single experiment were developed with anti-USP30 antibody. GAPDH was used as a loading control. (C) Cellular thermal shift assay was carried out in A172 cells treated with DMSO or Q14 peptide (100 µM) for 12 h. Representative immunoblot was developed with anti-USP30 antibody in a single experiment. GAPDH was used as a loading control. Quantification results are shown on the right. Data are presented as mean ± s.e.m. from three independent experiments. (D) Immunofluorescence showing the colocalization between USP30 and FITC-Q14 peptide. Scale bars: 10 μm. The intensity profiles of USP30 and FITC-Q14 peptide along the white line are plotted on the right panels, with the colocalizing sites marked by yellow arrows. Correlation was determined by Pearson’s coefficient (R value indicated). The white dotted-lined boxes indicate representative fields to be shown in magnification. (E) Immunofluorescence showing the colocalization between FITC-Q14 peptide and MitoTracker Red-marked mitochondrial. Scale bars: 10 μm. The intensity profiles of FITC-Q14 peptide and mitochondrial along the white line are plotted on the right panels, with the colocalizing sites marked by yellow arrows. Correlation was determined by Pearson’s coefficient (R value indicated). The white dotted-lined boxes indicate representative fields to be shown in magnification. Full-length gels for B and C are in Fig. S8.
