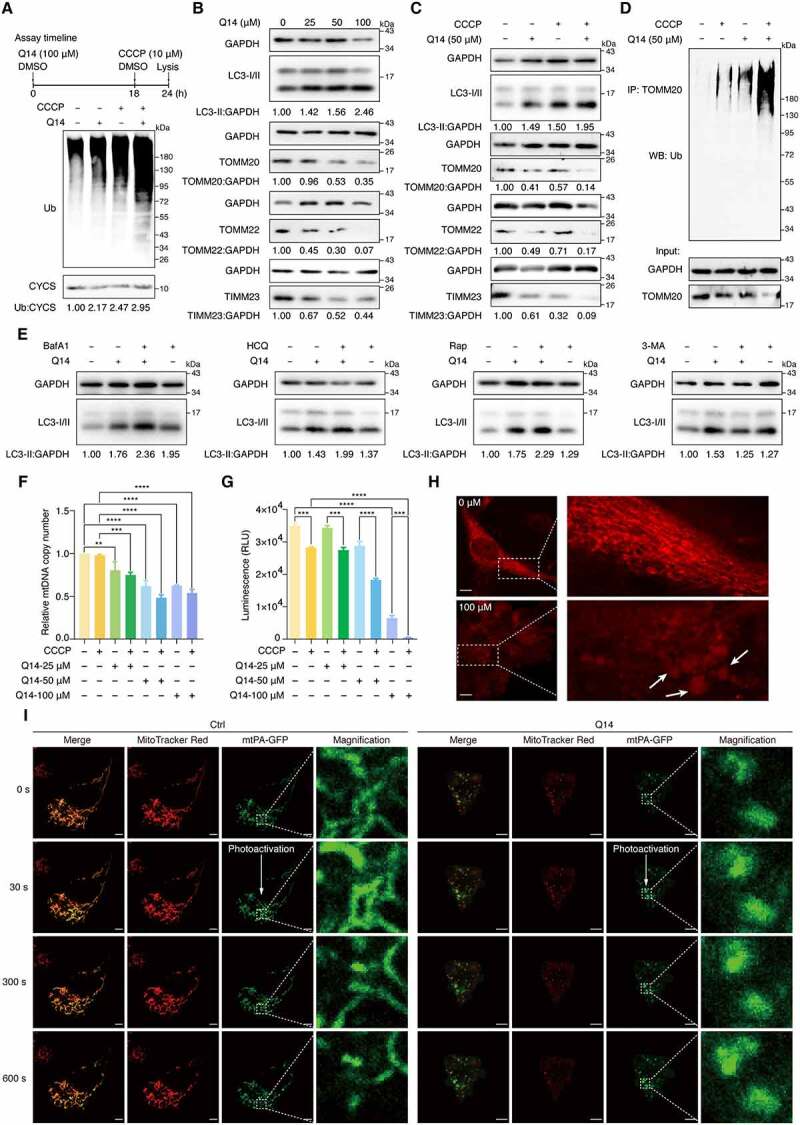
Figure 5.

Q14 peptide increased mitophagy by inhibiting USP30 deubiquitinating activity. (A) Deubiquitination of mitochondria was assessed by Western blot analysis using anti-ubiquitin antibody on A172 cells treated with DMSO, CCCP (10 µM, 6 h) and Q14 peptide (50 µM, 24 h). CYCS/cytochrome c was used as a loading control. The relative band intensities are quantified by image-J software and shown below the blots. Protein bands were normalized to CYCS/cytochrome c and then normalized to Ctrl. Assay timeline is shown on the top panel. (B) Immunoblotting for LC3-II, TOMM20, TOMM22 and TIMM23 was assessed in A172 cells incubated with gradient diluted Q14 peptide for 24 h. GAPDH was used as a loading control. The relative band intensities are quantified by image-J software and shown below the blots. Protein bands were normalized to GAPDH and then normalized to Ctrl. (C) A172 cells incubated with 50 µM Q14 peptide and CCCP as the timeline shown and lysed for Western blotting analysis with LC3-II, TOMM20, TOMM22 and TIMM23. GAPDH was used as a loading control. The relative band intensities are quantified by image-J software and shown below the blots. Protein bands were normalized to GAPDH and then normalized to Ctrl. (D) Ubiquitination of TOMM20 was assessed by immunoprecipitation developed with anti-ubiquitin antibody on A172 cells incubated with 50 µM Q14 and CCCP (10 µM, 6 h) for 24 h. (E) Immunoblotting analysis of LC3-II in A172 cells treated with Q14 peptide (50 µM) in the absence and presence of the inhibitors (bafilomycin A1 [100 nM; applied for the final 2 h of the 24 h], hydroxychloroquine [5 μM; applied for the final 2 h of the 24 h], rapamycin [5 μM; applied for the final 12 h of the 24 h] and 3-methyladenine [2 mM; applied for the final 12 h of the 24 h]). The relative band intensity of LC3-II was quantified by image-J software and shown below the blots. Protein bands were normalized to GAPDH and then normalized to Ctrl. (F) Quantification of mitochondrial DNA copy number in A172 cells treated with DMSO, CCCP (10 µM, 6 h) or different concentrations of Q14 peptide. Data was normalized to GAPDH gene and then normalized to Ctrl. Values are means ± s.d. from three independent experiments (n = 3). Statistical differences were determined by one-way ANOVA multiple comparisons using GraphPad Prism 8.0; **P< 0.01, *** P< 0.001, **** P< 0.0001. (G) Quantification of ATP contents in A172 cells treated with DMSO, CCCP (10 µM, 6 h) or different concentrations of Q14 peptide. Data are presented as mean ± s.d. from two independent experiments. Statistical differences were determined by one-way ANOVA multiple comparisons using GraphPad Prism 8.0; *** P< 0.001, **** P< 0.0001. (H) The morphology of mitochondrial was assessed by confocal imaging of A172 cells treated with increasing concentrations of Q14 peptide for 24 h. The fragmented and dot- or rod-like mitochondria are marked by white arrows. The white dotted-lined boxes indicate representative fields to be shown in magnification. Scale bar: 10 μm. (I) Representative images of mitochondrial fusion over time (indicated in second). A172 cells were transfected with mtPA-GFP for 24 h and stained with MitoTracker Red. Where indicated, A172 cells were treated with Q14 peptide (20 μM) for 2 h. mtPA-GFP was photoactivated in a region of interest (dashed white box) and cells were imaged by real-time confocal microscopy in 10 min. Scale bar: 5 µm. Experiments in A, B, C, D and E were repeated three times independently with similar results. Full-length gels for A, B, C, D and E are in Fig. S8.
