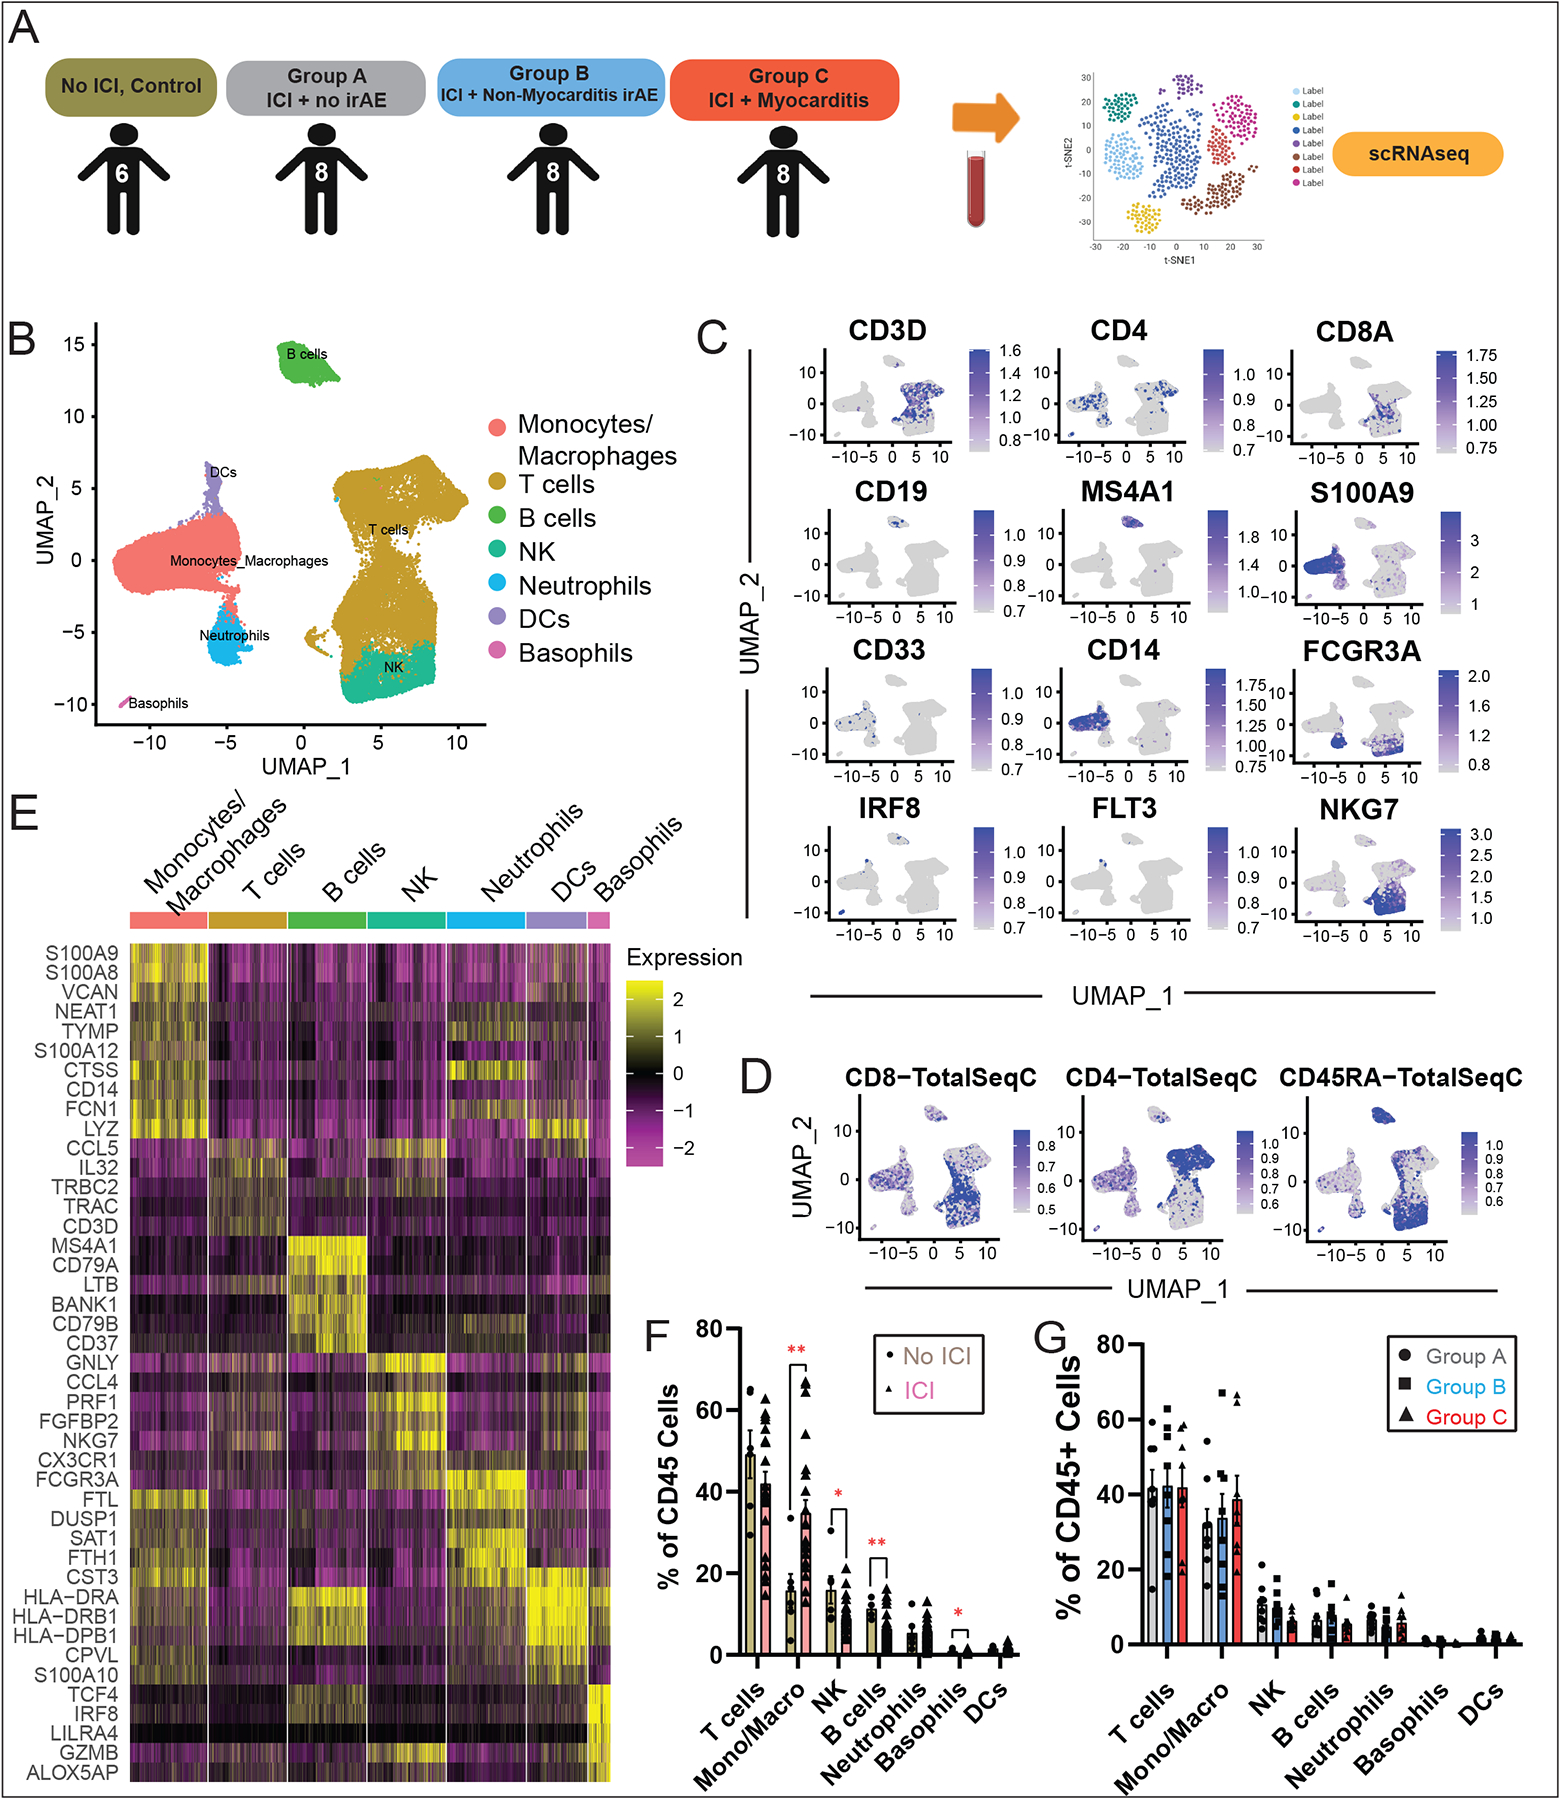
Fig. 2. Analysis of Immune Cell Populations in ICI Myocarditis Patients using scRNA-seq.

(A) Workflow showing collection of peripheral blood and processing of single-cell suspensions for single-cell RNA-seq. (B) Identification of peripheral blood CD45+ immune cell clusters across all samples (n=6–8 subjects per cohort). (C) Feature plots with canonical markers across CD45+ clusters. (D) Feature barcoding with CITE-seq showing surface markers CD45RA, CD4 and CD8, (E) Heatmap of top differentially expressed genes across clusters. (F) Quantification of CD45+ cell subtypes across clusters and comparison of non-ICI vs. ICI-treated patient groups showing an expansion of monocytes and a relative reduction in circulating T-cells in the ICI-treated groups compared to the “No ICI” control patients, as well as changes in NK, B-cells and basophils. For each cluster, the average fraction of cells from each patient group is shown, after normalization for total CD3+ input cell numbers per patient. Average and SEM are shown for each patient group. (G) Comparisons of CD45+ cell subtypes between groups A/B/C.
