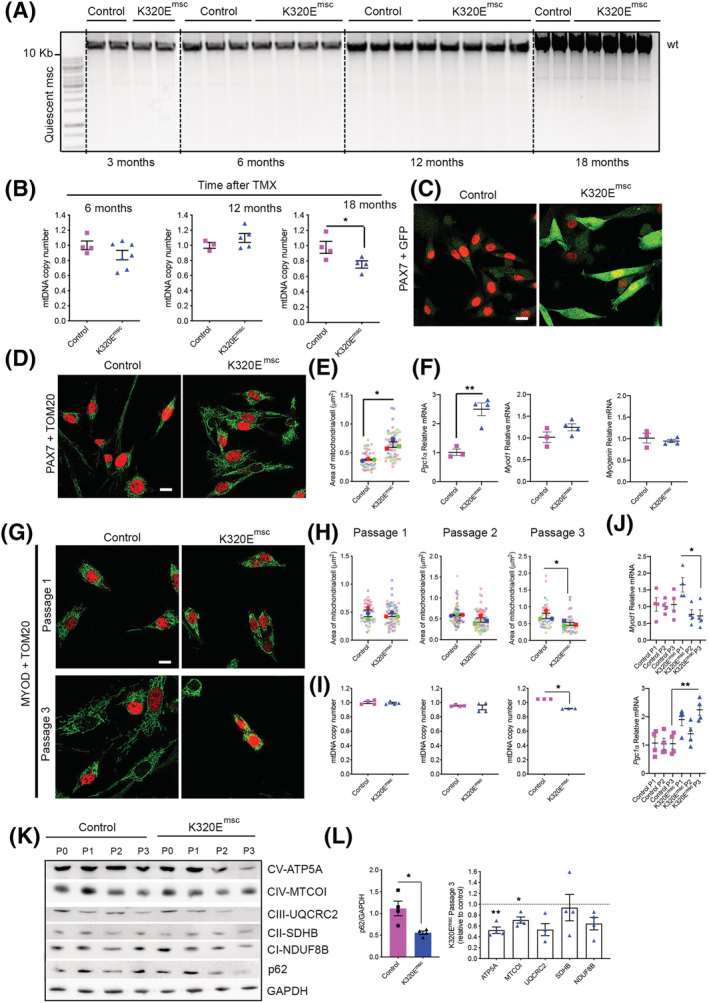
Figure 4.

K320E‐Twinkle expression in MuSCs leads to mtDNA depletion and increased autophagy. (A) Long‐range PCR for mtDNA alterations and (B) mtDNA copy number quantification in MuSCs isolated at different time points after in vivo tamoxifen (TMX) induction (n = 3–6 mice per time point). (C,D) Representative confocal images of freshly isolated satellite cells from 6‐ to 8‐week‐old mice after 48‐h 4‐hydroxytamoxifen induction. α‐GFP was used to monitor K320E‐Twinkle expression, α‐PAX7 as a satellite cell marker and α‐TOM20 as a mitochondrial marker. (E) Quantification of the area occupied by mitochondria in PAX7+ cells. (F) Expression of Pgc1α, Myod 1 and Myogenin in freshly isolated satellite cells from 6‐ to 8‐week‐old mice after 48 h hydroxytamoxifen induction. (G) Confocal images of proliferative satellite cells at the indicated time points. α‐MYOD was used as a MuSC proliferation marker. (H) Quantification of the area occupied by mitochondria in MYOD+ cells. (I) mtDNA copy number analysis in MuSCs at the indicated passage. (J) Expression of Pgc1α and Myod1 in MuSCs at the indicated passage. (K,L) Western blot analysis and relative quantification of respiratory chain proteins and p62 after three passages in MuSCs total protein extracts (P, passage). GAPDH was used as a loading control. N = 4 mice. Data is expressed as mean ± SEM. For image analysis n = 3 mice, >15 cells per mouse. *P < 0.05. Scale bar, 10 μm.
