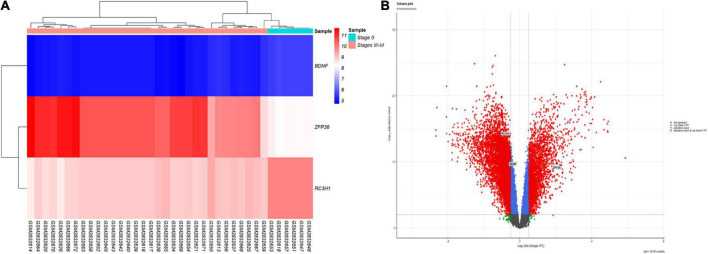
FIGURE 2.
Differentially expressed mRNAs in brain samples from patients with AD in Braak stages III to VI and control (CTL) samples. (A) Gene-specific heatmaps for the BDNF, TTP, and ROQUIN genes. Genes with a high level of expression are depicted in red, whereas those with a low level of expression are displayed in blue. (B) The DEGs’ volcano plan. Screening for DEGs was done using a | (log2FC) | > 0.5 and an adjusted p-value 0.001.

