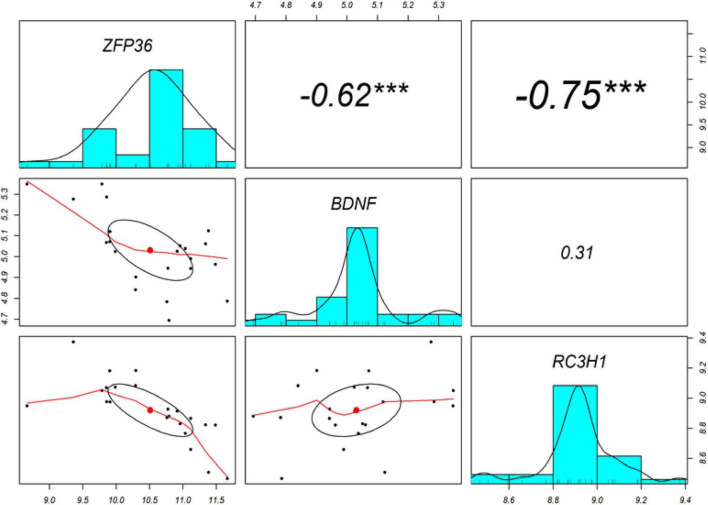
FIGURE 4.
The diagonal depicts the distribution of each variable. The bottom section of the diagonal depicts bivariate scatter plots with a fitted line. The correlation coefficients and significance level are presented as stars on the top section of the diagonal. ***Indicates a significant association with a p-value < 0.001.

