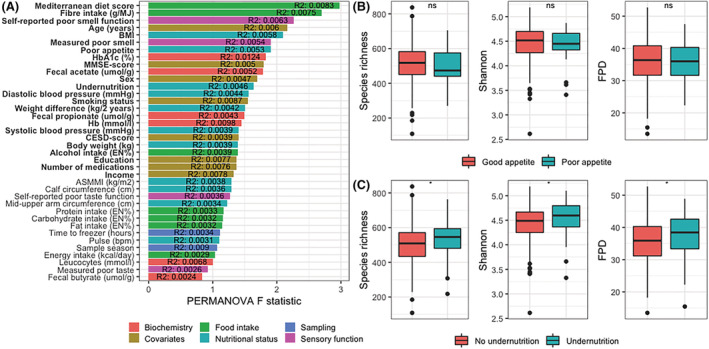
Figure 1.

Variables associated with alpha‐diversity and beta‐diversity in the human cohort. (A) Barplot showing the F‐statistic of the PERMANOVA model for each factor. Bars are coloured based on the type of variable. The R 2 is noted in each bar, depicting the variance in Bray–Curtis beta‐diversity explained by each variable. Bold text indicated statistical significance (P < 0.05). (B and C) Boxplots of alpha‐diversity measures species richness, Shannon index, and FPD for participants with or without poor appetite (B) and with or without undernutrition (C). Boxplots show median (centre line), interquartile ranges (boxes), 1.5× the interquartile ranges (whiskers), and outliers. Differences in alpha‐diversity were tested with linear regression models, adjusted for age and Mediterranean Diet Score. ASMMI, appendicular skeletal muscle mass index; CESD, Centre for Epidemiologic Studies Depression; FPD, Faith's phylogenetic diversity; MMSE, mini‐mental state examination.
