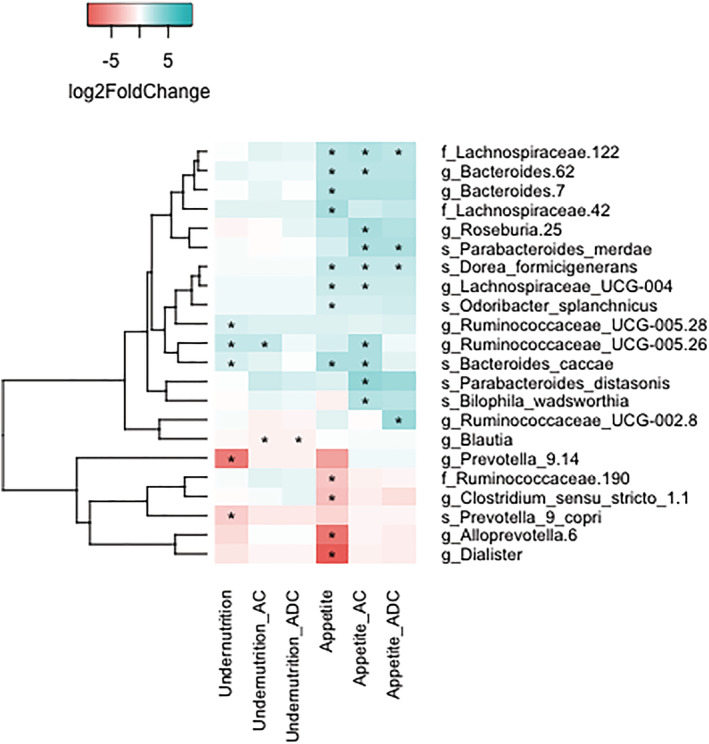
Figure 2.

Log2 fold change of all bacterial taxa significantly associated with either poor appetite or undernutrition. Heatmap depicting the log2 fold change in bacterial abundance of taxa that are significantly associated with either undernutrition or poor appetite. Log2 fold change was calculated with DESeq models, either crude (first and fourth column), adjusted for age (second and fifth column), or adjusted for both age and Mediterranean Diet Score (third and sixth column). Blue cells depict a positive log2 fold change, indicating higher abundance in participants with undernutrition or poor appetite, whereas red cells depict a negative log2 fold change, indicating lower abundance in participants with undernutrition or poor appetite. Numbers behind taxa are arbitrary identifiers for clades within the specified rank. Asterisks indicate Benjamini–Hochberg‐adjusted P‐value < 0.01. Taxa were only considered if the mean abundance was >10. AC, age corrected; ADC, age and diet corrected.
