Figure 4.

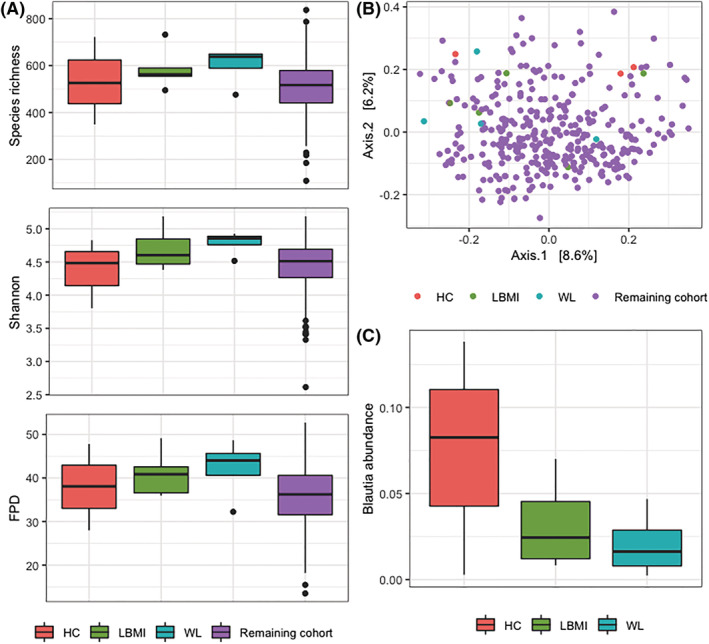
Alpha‐diversity, beta‐diversity, and Blautia of each of the donor groups. (A) Boxplots of species richness, Shannon diversity index, and FPD for each of the donor groups and the remaining cohort. Differences among groups were tested with Kruskal–Wallis tests. Boxplots show median (centre line), interquartile ranges (boxes), 1.5× the interquartile ranges (whiskers), and outliers. (B) Principal coordinate plot based on Bray–Curtis dissimilarity, coloured for each of the donor groups and the remaining cohort. Donors seem equally distributed throughout the cohort; donor group does not explain a significant amount of variance based on PERMANOVA. (C) Boxplot of Blautia abundance. There is no difference between donor groups based on Kruskal–Wallis test. Boxplots indicate same parameters as (A). FPD, Faith's phylogenetic diversity; HC, mice that received faecal microbiota from human donors without low body mass index or substantial weight loss; LBMI, mice that received faecal microbiota from human donors with low body mass index; WL, mice that received faecal microbiota from human donors with substantial weight loss.
