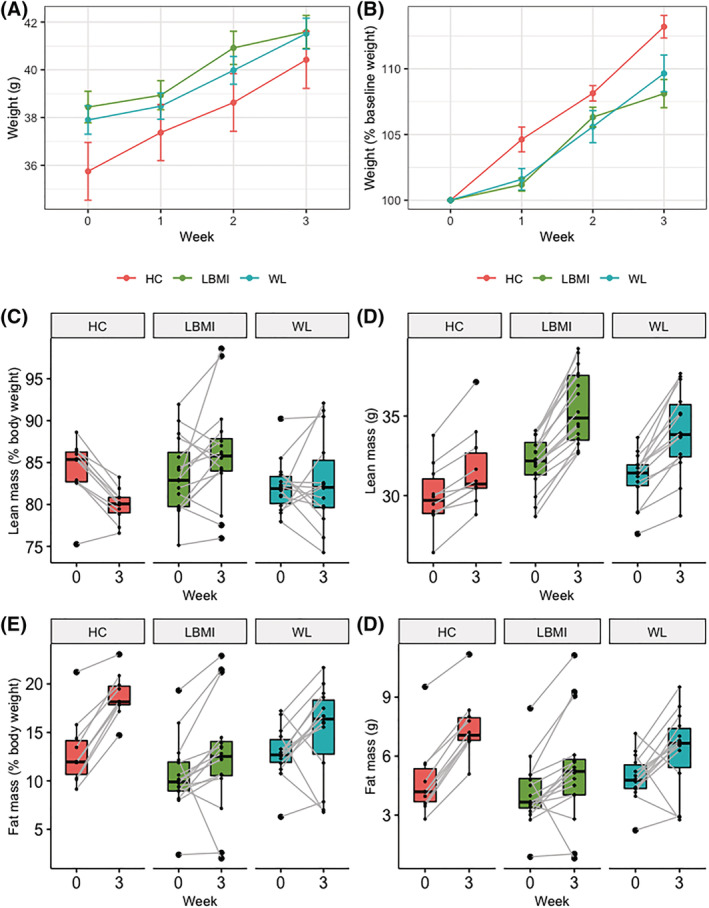
Figure 5.

Weight, lean mass, and fat mass of mice during experiment. (A and B) Line graphs for average body weight in g (A), and % of baseline weight (B) of mice per group during experiment (error bars indicate standard error). (C and D) Boxplots of lean mass in % of body weight (C) and g (D) per group at baseline and after a 3 week follow‐up. (E and F) Same as (C) and (D), but for fat mass. Boxplot centre line indicates median, boxes indicate interquartile ranges, whiskers indicate 1.5× the interquartile ranges, and paired measurements are connected by grey lines. HC, mice that received faecal microbiota from human donors without low body mass index or substantial weight loss; LBMI, mice that received faecal microbiota from human donors with low body mass index; WL, mice that received faecal microbiota from human donors with substantial weight loss.
