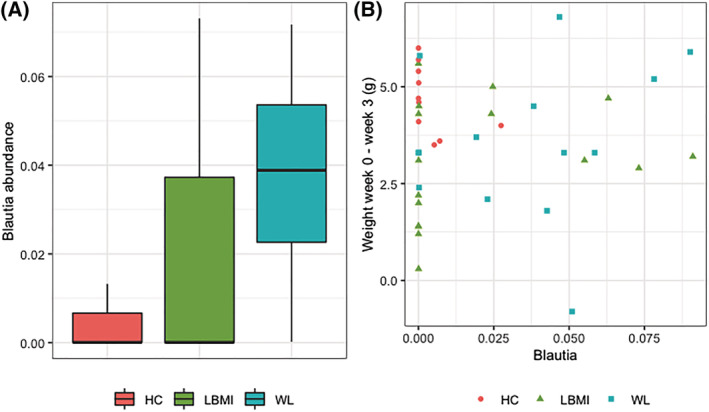
Figure 6.

Blautia abundance in Week 3 mouse faecal samples. (A) Boxplot for Blautia abundance in Week 3 mouse faecal samples per group. (B) Scatterplot of Blautia abundance in Week 3 mouse faecal samples plotted against the weight difference in the mice from baseline to Week 3. Boxplot centre line indicates median, boxes indicate interquartile ranges, whiskers indicate 1.5× the interquartile ranges, and paired measurements are connected by grey lines. HC, mice that received faecal microbiota from human donors without low body mass index or substantial weight loss; LBMI, mice that received faecal microbiota from human donors with low body mass index; WL, mice that received faecal microbiota from human donors with substantial weight loss.
