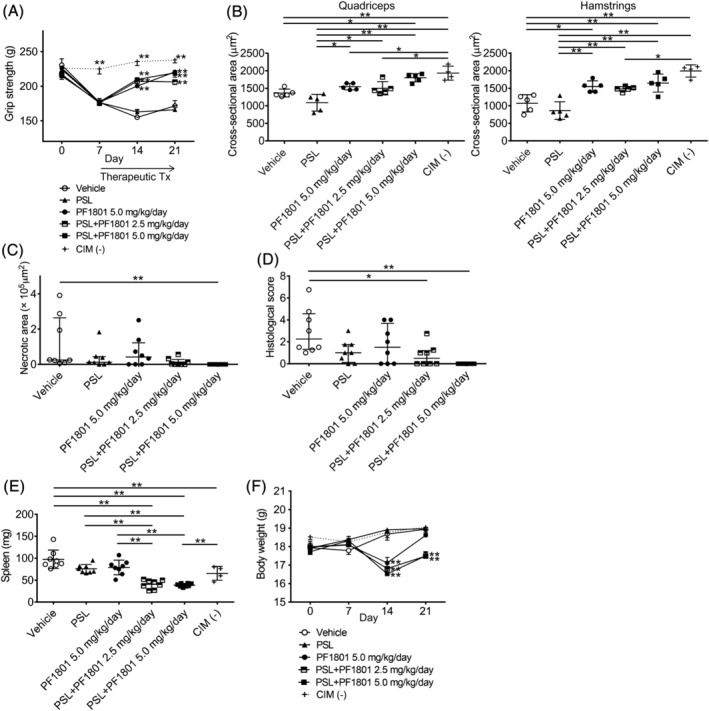
Figure 3.

Therapeutic effect of PF1801 on muscle weakness, muscle weight loss, and muscle inflammation in CIM. (A) the grip strength of CIM mice treated therapeutically (therapeutic Tx) with PF1801 (5.0 mg/kg/day, n = 8), PSL (n = 8), combination of PF1801 (2.5 mg/kg/day) and PSL (n = 8), combination of PF1801 (5.0 mg/kg/day) and PSL (n = 8), or vehicle (n = 8) and that of non‐CIM mice (n = 4). Two‐way ANOVA test, followed by Dunnetts multiple comparison test. **P < 0.01. (B) The mean cross‐sectional area (CSA) of muscle fibres of rectus femoris (quadriceps) and biceps femoris (hamstrings) of the mice on day 21 of CIM (n = 5; vehicle, 5; PSL, 5; PF1801 5.0 mg/kg/day, 5; PSL + PF1801 2.5 mg/kg/day, 5; PSL + PF1801 5.0 mg/kg/day, 4; non‐CIM). Data are presented as mean ± SD. One‐way ANOVA test, followed by Bonferroni post hoc test (all pairs). *P < 0.05, **P < 0.01. (C) The area of necrotic muscle fibres on day 21 of CIM. Data are presented as median ± interquartile range. Kruskal–Wallis test, followed by Dunns test. **P < 0.01. (D) The histological scores of the severity of myositis on day 21 of CIM. Data are presented as median ± interquartile range. Kruskal–Wallis test, followed by Dunns test. *P < 0.05, **P < 0.01. (E) The weight of spleen of the CIM on day 21 of CIM. Data are presented as mean ± SD. One‐way ANOVA test, followed by Bonferroni post hoc test (all pairs). **P < 0.01. (F) The body weight of the mice. Data are presented as mean ± SD. Two‐way ANOVA test, followed by Dunnett's multiple comparison test. **P < 0.01. (A–F) Data represent two independent experiments.
