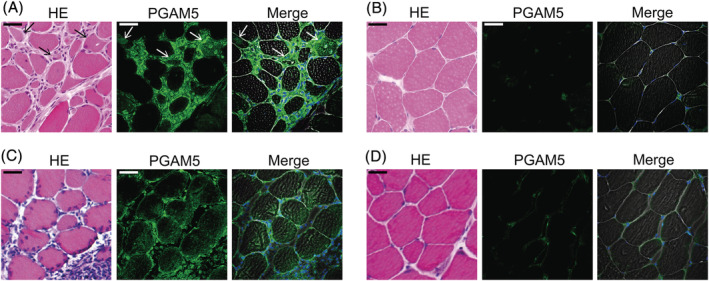
Figure 6.

Expression of PGAM5 in muscle fibres in PM and CIM. (A, B) representative images of muscle specimens of PM patients (n = 9) of (A) inflammatory area and (B) non‐inflammatory area. HE and immunofluorescence staining against PGAM5 (green). The arrows indicate the dying muscle fibres, which showed reduced eosin staining in the cytoplasm. Nuclei were counterstained with DAPI (blue) and merged images of PGAM5, DAPI and phase contrast were shown. Scale bar indicates 20 μm. (C, D) Representative images of muscle specimens of CIM of (C) inflammatory and (D) non‐inflammatory area. HE and immunofluorescence staining against PGAM5 (green). Nuclei were counterstained with DAPI (blue) and merged images of PGAM5, DAPI and phase contrast were shown. Scale bar indicates 20 μm.
