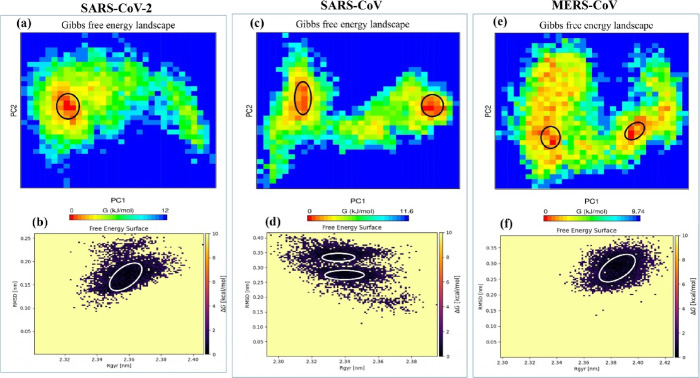
Figure 10.
Free energy landscape of PC1 and PC2 displaying the achievement of distinguishable local minima basins (in ΔG, kJ/mol) of NSP14–NSP10 complexes of (a) SARS-CoV-2, (c) SARS-CoV, and (e) MERS-CoV and corresponding free energy surface plots of (b) SARS-CoV-2, (d) SARS-CoV, and (f) MERS-CoV complexes with respect to their RMSD (nm) and Rg (nm).

