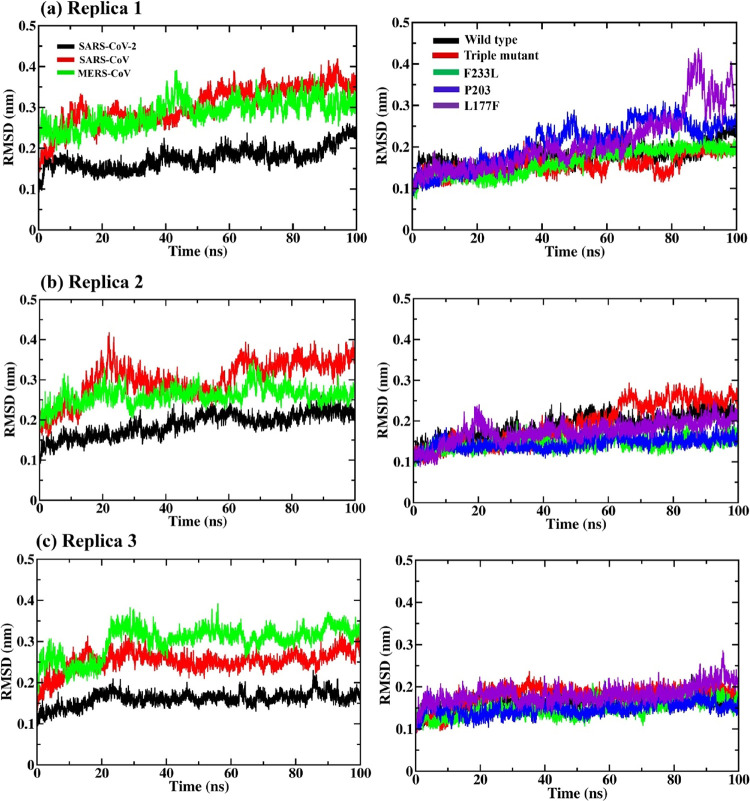
Figure 2.
Root mean square deviation (RMSD) graphs for (a–c) SARS-CoV-2, SARS-CoV, and MERS-CoV NSP14–NSP10 complexes (left side) and SARS-CoV-2 NSP14mutant complexes (right side) along the 100 ns MD simulations in triplicate. The triple mutant (in red, right-side plots) is the combination of the three (F233L, P203L, and L177F) mutations.

