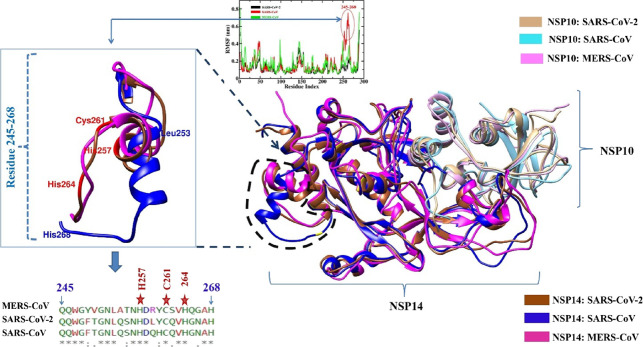
Figure 5.
Superimposed average structures (collected from the trajectories of last 20 ns) of the NSP14–NSP10 complex of SARS-CoV-2 with SARS-CoV and MERS-CoV. The square box (on the left side) depicts the C-terminal fluctuating residues ranging from 245 to 268. NSP14 SARS-CoV is depicted in blue color, SARS-CoV-2 is in brown, and MERS-CoV is in magenta.

