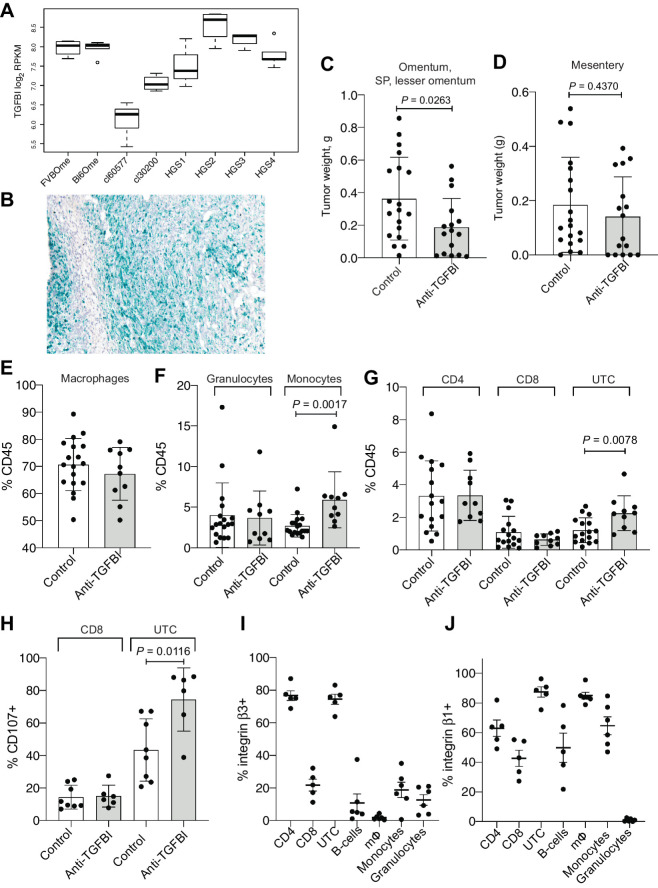
Figure 6.
Effect of anti-TGFBI treatment in an in vivo model of HGSOC. A, Boxplot of Tgfbi gene expression in log2 read counts per million (RPKM) across healthy omentum of FVB (n = 4) and C57BL6 mice (n = 5) and omental tumors from the 30200 (n = 4), 60577 (n = 5), HGS1 (n = 3), HGS2 (n = 4), HGS3 (n = 4), HGS4 models (n = 5) from GSE132289. B, RNA-scope for TGFBI in an omental tumor from the HGS2 model. C and D, Omentum, SP, LO (C) and mesenteric (D) tumor weight for mice injected with HGS2 and treated for 3 weeks with anti-TGFBI, starting at week 7 (n = 18 for controls; n = 10 for anti-TGFBI treated). Statistical significance was determined using unpaired t test. E–G, Percentage of macrophages, granulocytes, monocytes, CD4, CD8, and UTC among CD45-positive cells in omental tumors from control-treated and anti-TGFBI–treated mice (n = 18 for controls; n = 10 for anti-TGFBI treated). Statistical significance was determined using t test. H, Percentage of CD8 and UTC cells positive for CD107a (surface staining) in omental tumors from control-treated and anti-TGFBI–treated mice. (n = 8 for controls; n = 6 for anti-TGFBI treated). Statistical significance was determined using t test. I and J, Percentage of cells positive for integrin β3 and β1subunits staining on different populations of immune cells infiltrating untreated omental tumors generated by injecting HGS2 (percentage of integrin-positive cells for each population, from n = 5 tumors).

