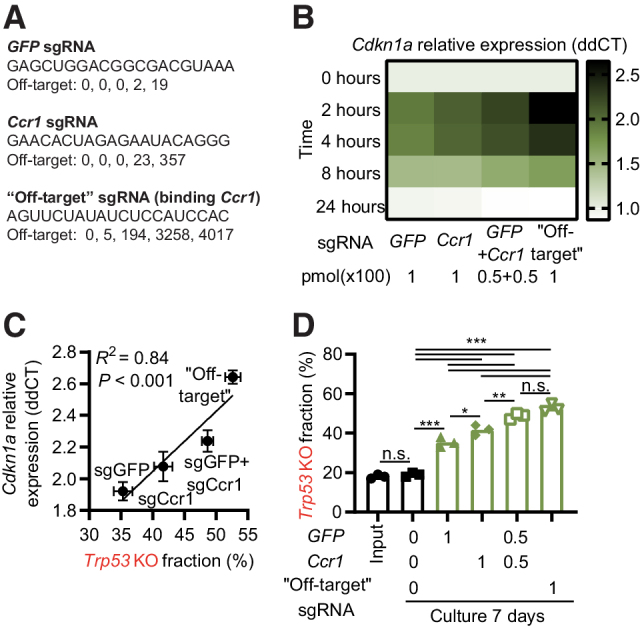
Figure 2.

The level of DDR induced by an sgRNA influences the enrichment of Trp53 KO cells. A, Information about sgRNAs used in the figure. Off-target indicates number of targets with 0, 1, 2, 3, and 4 mismatches to the mouse genome as identified by Cas-OFFinder. B, Hox cells (Cas9+ and GFP+) were electroporated with indicated sgRNAs, and Cdkn1a expression analyzed by qPCR at different time points. C, Comparison of the Cdkn1a expression by qPCR 2 hours after electroporation with indicated sgRNAs and enrichment of Trp53 KO sequences day 7. D,Trp53 KO and WT Hox cells (Cas9+ and GFP+) were mixed 1:4 and electroporated by different sgRNAs at the indicated doses (pmol × 100). Seven days later, cells were collected and sequenced to determine the percentage of Trp53 KO sequences. Data presented as heatmap based on the average signal, n = 3 (B), mean ± SEM, n = 3 (C), or mean and individual data, n = 3 (D). Data are combined from three independently performed experiments (B–D). *, P < 0.05; **, P < 0.01; ***, P < 0.001; n.s., nonsignificant by Pearson r correlation and simple linear regression line (C), or one-way ANOVA and Tukey posttest (D).
