. 2021 Nov 18;82(1):36–45. doi: 10.1158/0008-5472.CAN-21-1692

Figure 6.

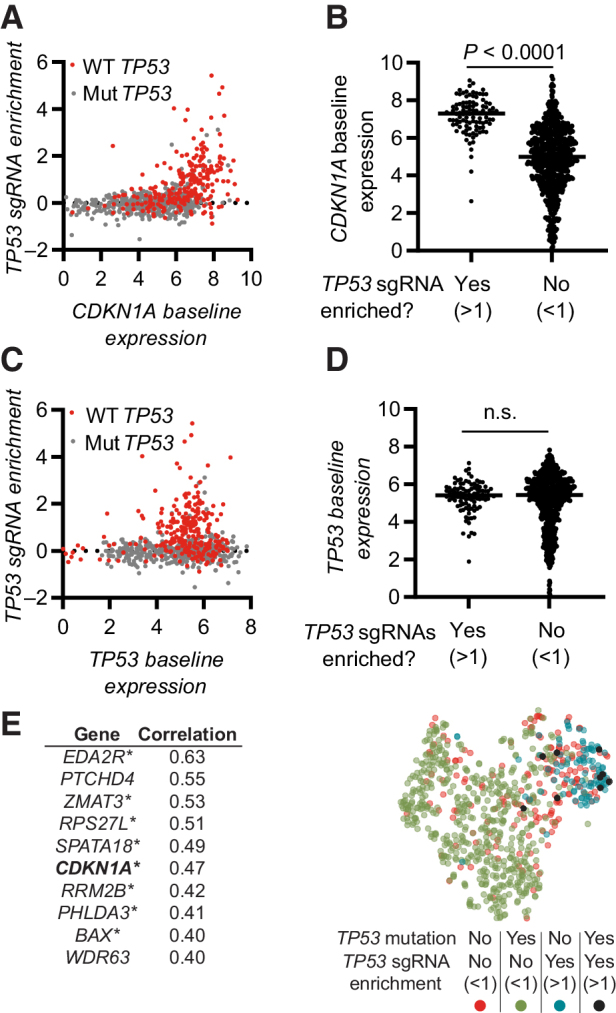
Figure 6. Gene expression patterns predicting if the CRISPR–p53 axis is active in a cell. A, Correlation of TP53 sgRNA enrichment with baseline CDKN1A expression. TP53 WT cells are indicated in red. B, Baseline CDKN1A expression in cells stratified on the basis of the enrichment of TP53 sgRNAs. C, Correlation of TP53 sgRNA enrichment with baseline TP53 expression. TP53 WT cells are indicated in red. D, Baseline TP53 expression in cells stratified on the basis of the enrichment of TP53 sgRNAs. E, Left, top 10 genes with expression correlating with enrichment of TP53 sgRNAs. *, genes identified as transcription factor target genes for p53. Right, tSNE dimensionality reduction analysis of cell based on expression of the 10 genes in E (left). Data include all available overlapping data in the Depmap CRISPR (Avana) 20Q4, Expression Public 20Q4. Each dot represents one cell line (A–D and E), n = 800. Statistical analysis based on unpaired t test (B and D) and calculated in Depmap (E). n.s., nonsignificant.

Gene expression patterns predicting if the CRISPR–p53 axis is active in a cell. A, Correlation of TP53 sgRNA enrichment with baseline CDKN1A expression. TP53 WT cells are indicated in red. B, Baseline CDKN1A expression in cells stratified on the basis of the enrichment of TP53 sgRNAs. C, Correlation of TP53 sgRNA enrichment with baseline TP53 expression. TP53 WT cells are indicated in red. D, Baseline TP53 expression in cells stratified on the basis of the enrichment of TP53 sgRNAs. E, Left, top 10 genes with expression correlating with enrichment of TP53 sgRNAs. *, genes identified as transcription factor target genes for p53. Right, tSNE dimensionality reduction analysis of cell based on expression of the 10 genes in E (left). Data include all available overlapping data in the Depmap CRISPR (Avana) 20Q4, Expression Public 20Q4. Each dot represents one cell line (A–D and E), n = 800. Statistical analysis based on unpaired t test (B and D) and calculated in Depmap (E). n.s., nonsignificant.