. 2021 Jul 21;81(18):4751–4765. doi: 10.1158/0008-5472.CAN-20-3941

Figure 2.

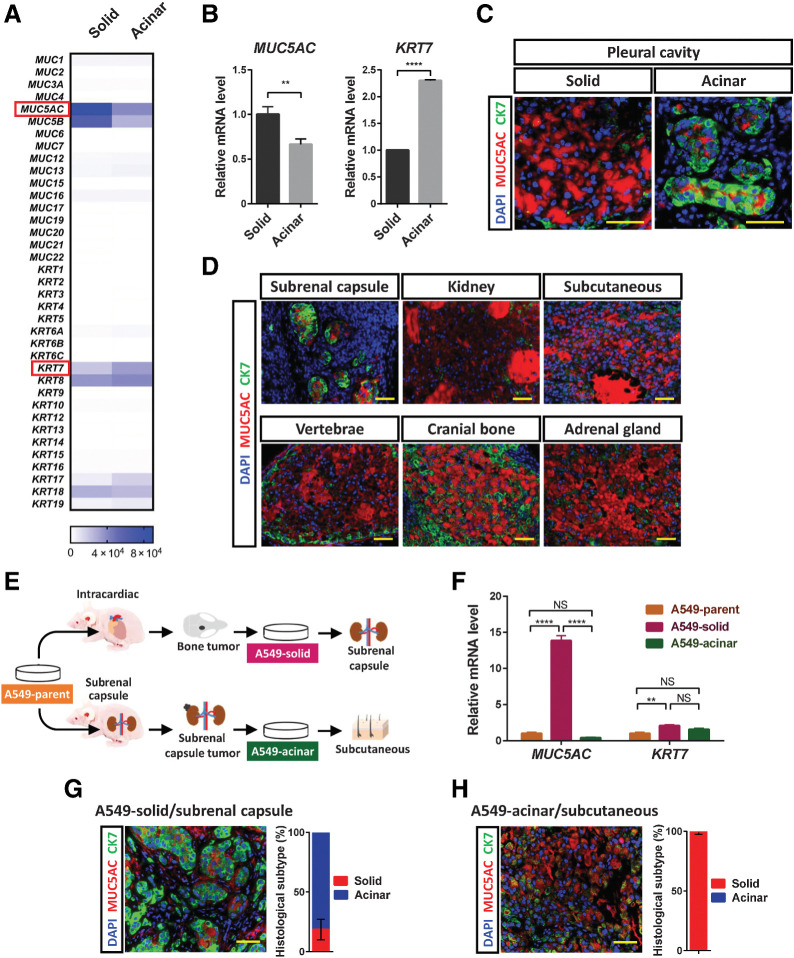
Figure 2. Environmental factors trigger SAT of A549 xenograft tumors. A, Heat map of the expression levels (counts) of mucin and cytokeratin genes determined by RNA-seq analysis of solid- or acinar-type tumor cells isolated by laser microdissection from pleural tumors formed by A549 cells in immunodeficient mice. Each sample is pooled from three mice in one experiment. B, RT and real-time PCR analysis of MUC5AC and KRT7 expression in solid- or acinar-type tumor cells isolated from pleural tumors by laser microdissection. The data were normalized by the amount of HPRT1 mRNA, are expressed relative to the corresponding value for solid-type tumor cells, and are means + SD for triplicate determinations. Each sample is pooled from three mice in one experiment. **, P < 0.01; ****, P < 0.0001 (unpaired two-tailed Student t test). C, Immunofluorescence staining for MUC5AC (red) and CK7 (green) in solid and acinar components of the same pleural tumor formed by A549 cells. Nuclei were stained with DAPI (blue). Scale bars, 50 μm. D, Immunofluorescence staining for MUC5AC (red) and CK7 (green) in A549 tumors formed at the indicated sites. Nuclei were stained with DAPI (blue). Scale bars, 50 μm. E, Experimental scheme for establishment of solid-type (A549-solid) and acinar-type (A549-acinar) tumor cells. For establishment of A549-solid cells, A549 cells (1 × 10⁵) were injected into the left ventricle, and tumor cells were subsequently isolated from cranial bone metastases and were maintained in culture. For establishment of A549-acinar cells, A549 cells (1 × 10⁶) were injected below the renal capsule, and cells were subsequently isolated from tumors that developed at the injection site and were maintained in culture. F, RT and real-time PCR analysis of MUC5AC and KRT7 expression in A549 parental cells, A549-solid cells, and A549-acinar cells. Data were normalized by the amount of HPRT1 mRNA, are expressed relative to the corresponding value for A549 parental cells, and are means + SD for triplicates of one of two independent experiments that yielded similar results. **, P < 0.01; ****, P < 0.0001; NS, not significant; by two-way ANOVA with Tukey multiple-comparison test. G and H, A549-solid cells were injected below the renal capsule (G), and A549-acinar cells were injected subcutaneously (H). The tumors that formed at each injection site were subjected to immunofluorescence staining for MUC5AC (red) and CK7 (green), and the percentage area of each histological subtype within individual tumors was determined. Nuclei were stained with DAPI (blue). Scale bars, 50 μm. The quantitative data are means ± SEM for three tumors at each site derived from three independent experiments.

Environmental factors trigger SAT of A549 xenograft tumors. A, Heat map of the expression levels (counts) of mucin and cytokeratin genes determined by RNA-seq analysis of solid- or acinar-type tumor cells isolated by laser microdissection from pleural tumors formed by A549 cells in immunodeficient mice. Each sample is pooled from three mice in one experiment. B, RT and real-time PCR analysis of MUC5AC and KRT7 expression in solid- or acinar-type tumor cells isolated from pleural tumors by laser microdissection. The data were normalized by the amount of HPRT1 mRNA, are expressed relative to the corresponding value for solid-type tumor cells, and are means + SD for triplicate determinations. Each sample is pooled from three mice in one experiment. **, P < 0.01; ****, P < 0.0001 (unpaired two-tailed Student t test). C, Immunofluorescence staining for MUC5AC (red) and CK7 (green) in solid and acinar components of the same pleural tumor formed by A549 cells. Nuclei were stained with DAPI (blue). Scale bars, 50 μm. D, Immunofluorescence staining for MUC5AC (red) and CK7 (green) in A549 tumors formed at the indicated sites. Nuclei were stained with DAPI (blue). Scale bars, 50 μm. E, Experimental scheme for establishment of solid-type (A549-solid) and acinar-type (A549-acinar) tumor cells. For establishment of A549-solid cells, A549 cells (1 × 10⁵) were injected into the left ventricle, and tumor cells were subsequently isolated from cranial bone metastases and were maintained in culture. For establishment of A549-acinar cells, A549 cells (1 × 10⁶) were injected below the renal capsule, and cells were subsequently isolated from tumors that developed at the injection site and were maintained in culture. F, RT and real-time PCR analysis of MUC5AC and KRT7 expression in A549 parental cells, A549-solid cells, and A549-acinar cells. Data were normalized by the amount of HPRT1 mRNA, are expressed relative to the corresponding value for A549 parental cells, and are means + SD for triplicates of one of two independent experiments that yielded similar results. **, P < 0.01; ****, P < 0.0001; NS, not significant; by two-way ANOVA with Tukey multiple-comparison test. G and H, A549-solid cells were injected below the renal capsule (G), and A549-acinar cells were injected subcutaneously (H). The tumors that formed at each injection site were subjected to immunofluorescence staining for MUC5AC (red) and CK7 (green), and the percentage area of each histological subtype within individual tumors was determined. Nuclei were stained with DAPI (blue). Scale bars, 50 μm. The quantitative data are means ± SEM for three tumors at each site derived from three independent experiments.