. 2021 Jul 21;81(18):4751–4765. doi: 10.1158/0008-5472.CAN-20-3941

Figure 4.

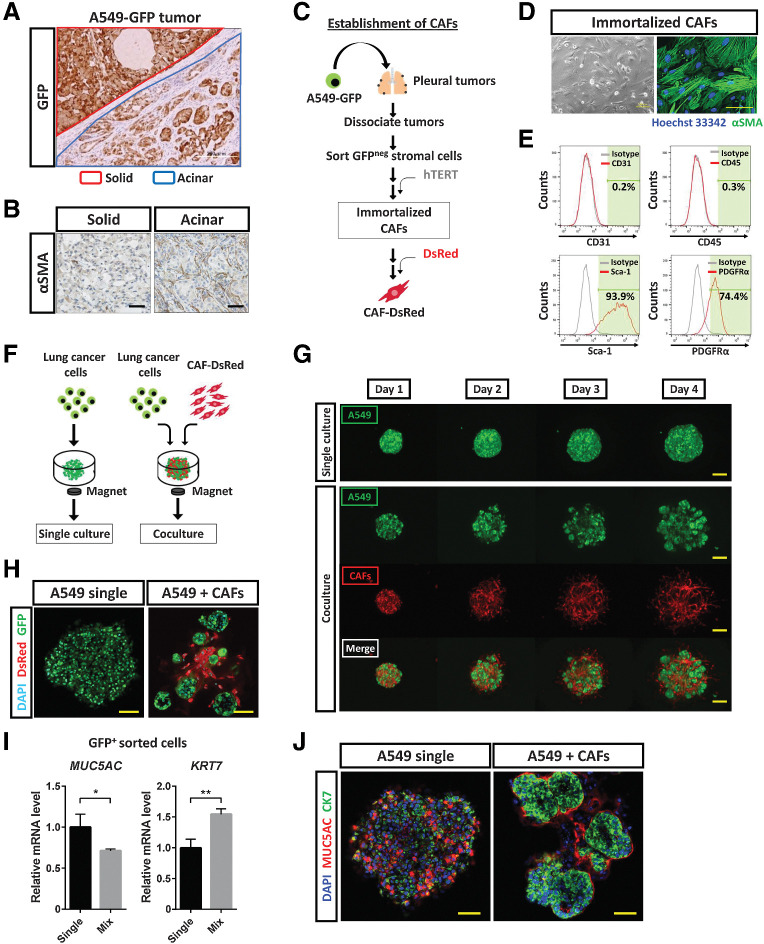
Figure 4. CAFs induce histological transition of lung cancer cells. A, Immunohistochemical staining for GFP in tumors developed after subrenal capsular injection of A549-GFP cells in immunodeficient mice. The red line demarcates a solid-type tumor in the kidney parenchyma, and the blue line an acinar-type tumor below the renal capsule. Scale bar, 200 μm. The image is representative of three independent experiments. B, Immunohistochemical staining for αSMA in solid and acinar tumors formed after subrenal capsular injection of A549-GFP cells. Scale bars, 50 μm. The images are representative of three independent experiments. C, Experimental scheme for establishment of immortalized CAFs. A549-GFP cells were injected into the pleural cavity of immunodeficient mice. After 6 weeks, pleural tumors were isolated and dissociated into single cells, GFP-negative stromal cells were collected by fluorescence-activated cell sorting, and human TERT cDNA was introduced into the stromal cells. The resulting immortalized CAFs were then labeled with DsRed. D, Phase-contrast microscopy and immunofluorescence staining for αSMA (green) in immortalized CAFs. Nuclei were stained with Hoechst 33342 (blue) in the immunofluorescence image. Scale bars, 100 μm (left) and 50 μm (right). The images are representative of three independent experiments. E, Flow cytometric analysis of CD31, CD45, Sca-1, and PDGFRα in immortalized CAFs. Data are representative of two independent experiments. F, Experimental scheme for 3D culture of GFP-labeled lung cancer cells with or without DsRed-labeled immortalized CAFs in medium containing 5% Matrigel for 4 days. G, Live imaging of GFP and DsRed fluorescence for A549-GFP colonies formed in the absence or presence of DsRed-labeled CAFs during 3D culture. Scale bars, 200 μm. The images are representative of three independent experiments. H, Confocal microscopy of GFP (green) and DsRed (red) immunofluorescence for tumor colonies formed by A549-GFP cells cultured alone or together with DsRed-labeled CAFs for 4 days. Nuclei were stained with DAPI (blue). Scale bars, 50 μm. The images are representative of three independent experiments. I, RT and real-time PCR analysis of MUC5AC and KRT7 expression in GFP+ cells sorted from A549-GFP tumor colonies formed as in H. Data were normalized by the amount of HPRT1 mRNA, are expressed relative to the corresponding value for the cells derived from CAF-free colonies, and are means + SD from two independent experiments. *, P < 0.05; **, P < 0.01 (unpaired two-tailed Student t test). J, Confocal microscopy of MUC5AC (red) and CK7 (green) immunofluorescence for tumor colonies formed as in H. Nuclei were stained with DAPI (blue). Scale bars, 50 μm. The images are representative of two independent experiments.

CAFs induce histological transition of lung cancer cells. A, Immunohistochemical staining for GFP in tumors developed after subrenal capsular injection of A549-GFP cells in immunodeficient mice. The red line demarcates a solid-type tumor in the kidney parenchyma, and the blue line an acinar-type tumor below the renal capsule. Scale bar, 200 μm. The image is representative of three independent experiments. B, Immunohistochemical staining for αSMA in solid and acinar tumors formed after subrenal capsular injection of A549-GFP cells. Scale bars, 50 μm. The images are representative of three independent experiments. C, Experimental scheme for establishment of immortalized CAFs. A549-GFP cells were injected into the pleural cavity of immunodeficient mice. After 6 weeks, pleural tumors were isolated and dissociated into single cells, GFP-negative stromal cells were collected by fluorescence-activated cell sorting, and human TERT cDNA was introduced into the stromal cells. The resulting immortalized CAFs were then labeled with DsRed. D, Phase-contrast microscopy and immunofluorescence staining for αSMA (green) in immortalized CAFs. Nuclei were stained with Hoechst 33342 (blue) in the immunofluorescence image. Scale bars, 100 μm (left) and 50 μm (right). The images are representative of three independent experiments. E, Flow cytometric analysis of CD31, CD45, Sca-1, and PDGFRα in immortalized CAFs. Data are representative of two independent experiments. F, Experimental scheme for 3D culture of GFP-labeled lung cancer cells with or without DsRed-labeled immortalized CAFs in medium containing 5% Matrigel for 4 days. G, Live imaging of GFP and DsRed fluorescence for A549-GFP colonies formed in the absence or presence of DsRed-labeled CAFs during 3D culture. Scale bars, 200 μm. The images are representative of three independent experiments. H, Confocal microscopy of GFP (green) and DsRed (red) immunofluorescence for tumor colonies formed by A549-GFP cells cultured alone or together with DsRed-labeled CAFs for 4 days. Nuclei were stained with DAPI (blue). Scale bars, 50 μm. The images are representative of three independent experiments. I, RT and real-time PCR analysis of MUC5AC and KRT7 expression in GFP+ cells sorted from A549-GFP tumor colonies formed as in H. Data were normalized by the amount of HPRT1 mRNA, are expressed relative to the corresponding value for the cells derived from CAF-free colonies, and are means + SD from two independent experiments. *, P < 0.05; **, P < 0.01 (unpaired two-tailed Student t test). J, Confocal microscopy of MUC5AC (red) and CK7 (green) immunofluorescence for tumor colonies formed as in H. Nuclei were stained with DAPI (blue). Scale bars, 50 μm. The images are representative of two independent experiments.