. 2021 Jul 21;81(18):4751–4765. doi: 10.1158/0008-5472.CAN-20-3941

Figure 5.

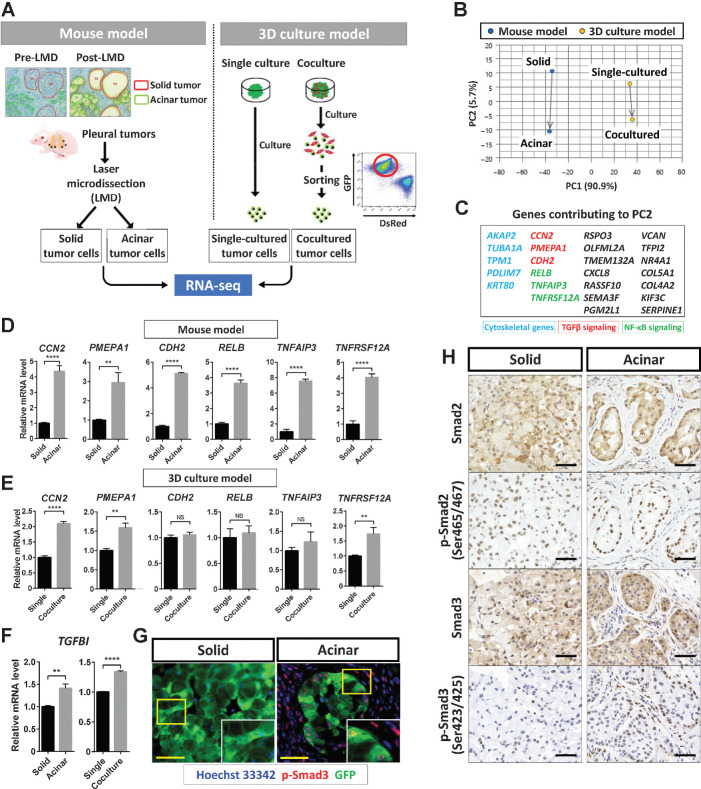
Figure 5. TGFβ signaling is activated in acinar-type tumor cells. A, Experimental scheme for RNA-seq analysis of solid- or acinar-type tumor cells derived from pleural tumors formed by A549 cells in immunodeficient mice or from tumor colonies formed by A549 cells cultured with (acinar) or without (solid) CAFs in vitro. B, PCA plots for the transcriptomes of solid- or acinar-type tumor cells determined as in A. Blue dots, cells isolated by laser microdissection (LMD) from the mouse tumor model; yellow dots, cells sorted from the 3D coculture model. C, Genes contributing to PC2 that are positively related to the change from solid-to-acinar type in the PCA analysis. Those related to the cytoskeleton (blue), to TGFβ signaling (red), or to NF-κB signaling (green) are highlighted. D and E, RT and real-time PCR analysis of genes related to TGFβ signaling (CCN2, PMEPA1, and CDH2) or to NF-κB signaling (RELB, TNFAIP3, and TNFRSF12A) in cells isolated as in A from the mouse model (D) or from the 3D coculture model (E). F, RT and real-time PCR analysis of TGFBI expression in cells as in D and E. Data in D through F were normalized by the amount of HPRT1 mRNA, are expressed relative to the corresponding value for solid-type tumor cells or single-cultured tumor cells, and are means + SD of triplicates. Each sample is pooled from three mice examined in one experiment. **, P < 0.01; ****, P < 0.0001 (unpaired two-tailed Student t test). G, Immunofluorescence staining for GFP (green) and p-Smad3 (red) in solid or acinar tumors formed after subrenal capsule injection of A549-GFP cells in immunodeficient mice. Nuclei were stained with Hoechst 33342 (blue). Scale bars, 50 μm. The images are representative of two independent experiments. H, Immunohistochemical staining for Smad2, p-Smad2, Smad3, and p-Smad3 in solid- or acinar-type tumors as in G. Scale bars, 50 μm. The images are representative of two independent experiments.

TGFβ signaling is activated in acinar-type tumor cells. A, Experimental scheme for RNA-seq analysis of solid- or acinar-type tumor cells derived from pleural tumors formed by A549 cells in immunodeficient mice or from tumor colonies formed by A549 cells cultured with (acinar) or without (solid) CAFs in vitro. B, PCA plots for the transcriptomes of solid- or acinar-type tumor cells determined as in A. Blue dots, cells isolated by laser microdissection (LMD) from the mouse tumor model; yellow dots, cells sorted from the 3D coculture model. C, Genes contributing to PC2 that are positively related to the change from solid-to-acinar type in the PCA analysis. Those related to the cytoskeleton (blue), to TGFβ signaling (red), or to NF-κB signaling (green) are highlighted. D and E, RT and real-time PCR analysis of genes related to TGFβ signaling (CCN2, PMEPA1, and CDH2) or to NF-κB signaling (RELB, TNFAIP3, and TNFRSF12A) in cells isolated as in A from the mouse model (D) or from the 3D coculture model (E). F, RT and real-time PCR analysis of TGFBI expression in cells as in D and E. Data in D through F were normalized by the amount of HPRT1 mRNA, are expressed relative to the corresponding value for solid-type tumor cells or single-cultured tumor cells, and are means + SD of triplicates. Each sample is pooled from three mice examined in one experiment. **, P < 0.01; ****, P < 0.0001 (unpaired two-tailed Student t test). G, Immunofluorescence staining for GFP (green) and p-Smad3 (red) in solid or acinar tumors formed after subrenal capsule injection of A549-GFP cells in immunodeficient mice. Nuclei were stained with Hoechst 33342 (blue). Scale bars, 50 μm. The images are representative of two independent experiments. H, Immunohistochemical staining for Smad2, p-Smad2, Smad3, and p-Smad3 in solid- or acinar-type tumors as in G. Scale bars, 50 μm. The images are representative of two independent experiments.