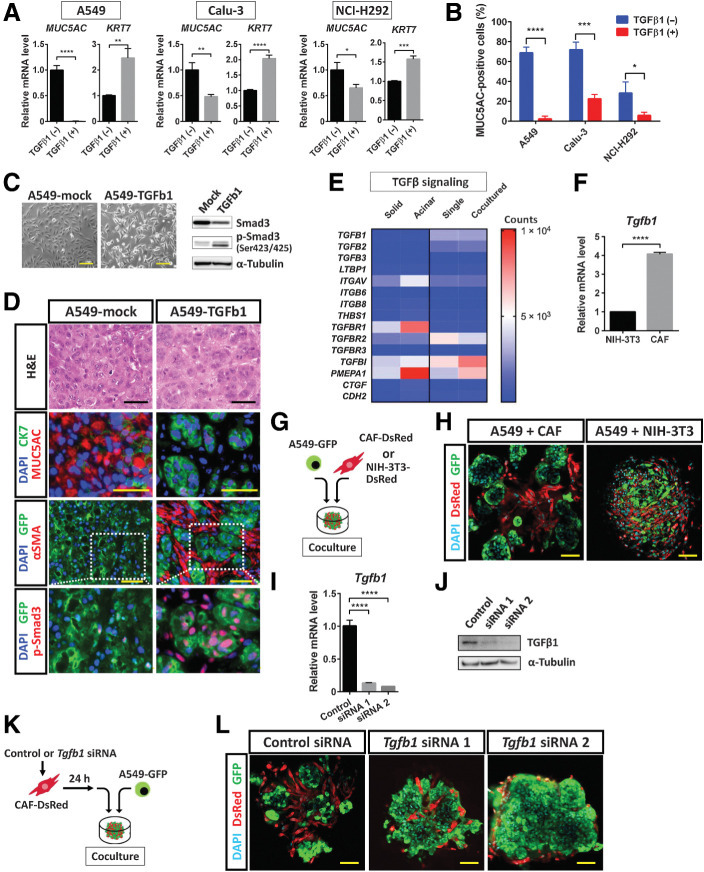
Figure 6.
TGFβ1 signaling mediated by CAFs contributes to SAT induction in lung cancer cells. A, RT and real-time PCR analysis of MUC5AC and KRT7 expression in A549, Calu-3, and NCI-H292 lung cancer cells cultured in the absence or presence of TGFβ1 (2 ng/mL) for 24 hours. Data were normalized by the amount of HPRT1 mRNA, are expressed relative to the corresponding value for cells cultured in the absence of TGFβ1, and are means + SD from three independent experiments. *, P < 0.05; **, P < 0.01; ***, P < 0.001; ****, P < 0.0001 (unpaired two-tailed Student t test). B, Flow cytometric analysis of MUC5AC expression in A549, Calu-3, and NCI-H292 cells cultured under mucinous differentiation conditions in the absence or presence of TGFβ1 (2 ng/mL) for 48 hours. Data are means + SD for the percentage of MUC5AC-positive cells from three independent experiments (a representative experiment is shown in Supplementary Fig. S5A). *, P < 0.05; ***, P < 0.001; ****, P < 0.0001 (unpaired two-tailed Student t test). C, Phase-contrast microscopy of (left; scale bars, 50 μm) as well as immunoblot analysis (right) of Smad3 and p-Smad3 in A549-TGFb1 cells (expressing GFP and an active form of TGFβ1) and control (A549-mock) cells. α-Tubulin was examined as a loading control for immunoblot analysis. Data are representative of two independent experiments. D, Hematoxylin and eosin (H&E) staining as well as immunofluorescence staining for MUC5AC (red) and CK7 (green), GFP (green) and αSMA (red), or GFP (green) and p-Smad3 (red), as indicated, in subcutaneous tumors formed by A549-mock or A549-TGFb1 cells in immunodeficient mice. Nuclei were stained with DAPI (blue) in the immunofluorescence images. Scale bars, 50 μm. Data are representative of three independent experiments. E, Heat map of expression levels (counts) of TGFβ signaling–related genes derived from RNA-seq data of solid- and acinar-type tumor cells from both xenograft tumor and 3D coculture models (see Fig. 5A). F, RT and real-time PCR analysis of Tgfb1 expression in NIH3T3 fibroblasts and immortalized mouse CAFs. Data were normalized by the amount of B2 m mRNA, are expressed relative to the value for NIH3T3 cells, and are means + SD of triplicates from one of two similar experiments. ****, P < 0.0001 (unpaired two-tailed Student t test). G, Experimental scheme for 3D coculture of A549-GFP cells with CAF-DsRed or NIH3T3–DsRed cells for 4 days. H, Confocal microscopy of GFP (green) and DsRed (red) immunofluorescence in colonies formed as in G. Nuclei were stained with DAPI (blue). Scale bars, 50 μm. The images are representative of two independent experiments. I and J, RT and real-time PCR analysis of Tgfb1 mRNA (I) and immunoblot analysis of TGFβ1 (J) in CAF-DsRed cells transfected with a control siRNA or Tgfb1 siRNAs 1 or 2 for 48 hours. The RT-PCR data were normalized by the amount of B2 m mRNA, are expressed relative to the value for cells transfected with the control siRNA, and are means + SD from three independent experiments. ****, P < 0.0001 (unpaired two-tailed Student t test). The immunoblot data are representative of two independent experiments. K, Experimental scheme for 3D coculture of A549-GFP cells with CAF-DsRed cells transfected with siRNAs as in I and J. L, Confocal microscopy of GFP (green) and DsRed (red) immunofluorescence in colonies formed after 4 days in culture as in K. Nuclei were stained with DAPI (blue). Scale bars, 50 μm. The images are representative of two independent experiments.

