Figure 7.
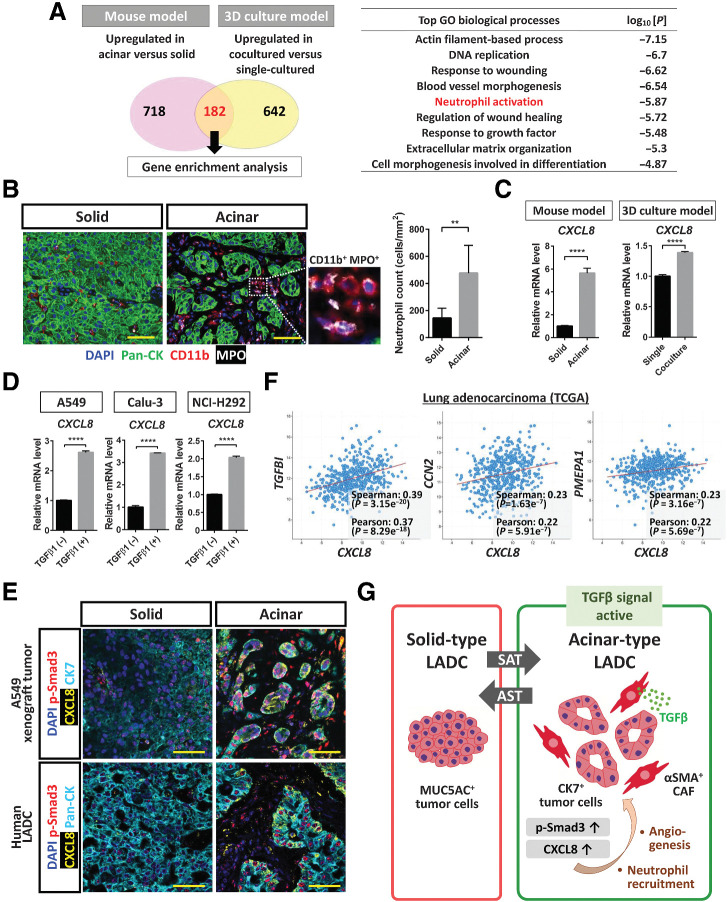
CXCL8 expression is upregulated by TGFβ-Smad3 signaling in acinar-type tumor cells. A, Enrichment analysis for genes whose expression was upregulated in acinar-type cells compared with solid-type cells in both the mouse xenograft and 3D culture models as determined from RNA-seq data (see Fig. 5A). The most significantly enriched GO terms for biological processes are listed together with the corresponding P values. B, Immunofluorescence staining for pan-CK (green), CD11b (red), and MPO (gray) in solid and acinar components of a pleural tumor formed after injection of A549 cells in immunodeficient mice. Nuclei were stained with DAPI (blue). Scale bars, 50 μm. The number of neutrophils (CD11b+MPO+ cells) in solid or acinar components of the tumor tissue was also quantified, with the presented data being means + SD from three independent experiments. **, P < 0.01 (unpaired two-tailed Student t test). C, RT and real-time PCR analysis of CXCL8 expression in solid- or acinar-type tumor cells isolated from A549 pleural tumor tissue or from A549 colonies cultured in the absence or presence of CAFs. Data were normalized by the amount of HPRT1 mRNA, are expressed relative to the corresponding value for solid-type tumor cells or single-cultured tumor cells, and are means + SD of triplicates. Each sample was pooled from three mice in one experiment. ****, P < 0.0001 (unpaired two-tailed Student t test). D, RT and real-time PCR analysis of CXCL8 expression in A549, Calu-3, and NCI-H292 lung cancer cells cultured in the absence or presence of TGFβ1 (2 ng/mL) for 48 hours. Data were normalized by the amount of HPRT1 mRNA, are expressed relative to the corresponding value for cells cultured in the absence of TGFβ1, and are means + SD from three independent experiments. ****, P < 0.0001 (unpaired two-tailed Student t test). E, Immunofluorescence staining for CK7 or pan-CK (cyan), for p-Smad3 (red), and for CXCL8 (yellow) in solid and acinar components either of an A549 pleural tumor (top) or of a human LADC tumor (bottom). Nuclei were stained with DAPI (blue). Scale bars, 50 μm. The image of the A549 xenograft tumor is representative of three independent experiments, and one human LADC tumor was examined. F, Relationship between CXCL8 and TGFBI, CCN2, or PMEPA1 expression levels determined from RNA-seq data for 566 LADC tumors in TCGA. Spearman and Pearson correlation coefficients are indicated. G, LADC cells form tumors with distinct histological features, including MUC5AC-expressing solid-type and CK7-expressing acinar-type tumors. In a manner dependent on the tumor microenvironment, these two types of tumor can undergo interconversion. αSMA-positive CAFs surrounding LADC cells induce the formation of acinar tumor tissue by eliciting TGFβ–Smad3 signaling and consequent SAT in the tumor cells. Activation of TGFβ signaling also contributes to upregulation of CXCL8 expression in LADC cells, which has the potential to lead to changes in the tumor microenvironment, including the induction of angiogenesis and the recruitment of neutrophils into the tumor tissue.

