. 2021 Nov 22;82(2):264–277. doi: 10.1158/0008-5472.CAN-21-1171

Figure 2.

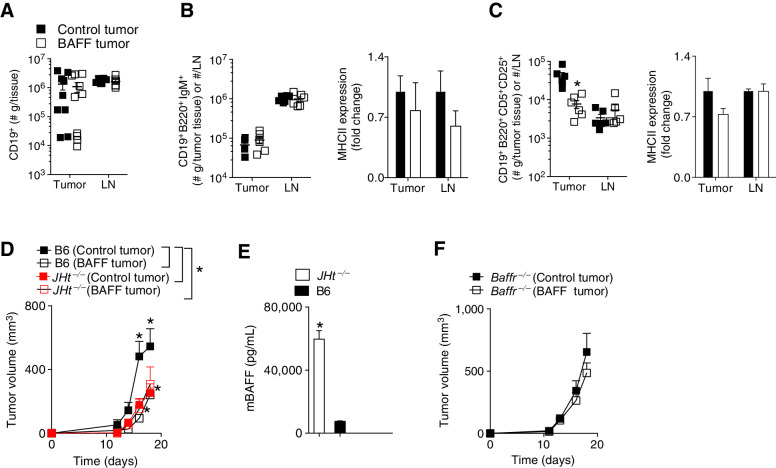
Figure 2. Difference in tumor growth between BAFF and control tumors is abrogated in JHt−/− and Baffr−/− mice. C57BL/6 (B6), JHt−/− or Baffr−/− mice were inoculated subcutaneously with 5 × 10⁵ of BAFF-expressing or control cells and tumors were analyzed as indicated on day 13 after tumor inoculation. A, Numbers of CD19+ B cells in the tumor and tumor-draining lymph node (LN) were assessed using FACS in B6 mice (n = 6–10). B and C, Numbers and surface MHCII expression of CD19+B220+IgM+ (B) and CD19+B220+CD5+CD25+ (C) B cells in the tumor and lymph node are shown (n = 6). D and F, Tumor growth was analyzed in JHt−/− or Baffr−/− mice (n = 4–9, pooled from at least two independent in vivo experiments). E, Serum levels of BAFF in naïve B6, or JHt−/− mice were analyzed by ELISA (n = 4–5). Error bars in all experiments indicate SEM. *, P < 0.05 as determined by a Student t test (unpaired, two-tailed) or a two-way ANOVA with a post hoc test.

Difference in tumor growth between BAFF and control tumors is abrogated in JHt−/− and Baffr−/− mice. C57BL/6 (B6), JHt−/− or Baffr−/− mice were inoculated subcutaneously with 5 × 10⁵ of BAFF-expressing or control cells and tumors were analyzed as indicated on day 13 after tumor inoculation. A, Numbers of CD19+ B cells in the tumor and tumor-draining lymph node (LN) were assessed using FACS in B6 mice (n = 6–10). B and C, Numbers and surface MHCII expression of CD19+B220+IgM+ (B) and CD19+B220+CD5+CD25+ (C) B cells in the tumor and lymph node are shown (n = 6). D and F, Tumor growth was analyzed in JHt−/− or Baffr−/− mice (n = 4–9, pooled from at least two independent in vivo experiments). E, Serum levels of BAFF in naïve B6, or JHt−/− mice were analyzed by ELISA (n = 4–5). Error bars in all experiments indicate SEM. *, P < 0.05 as determined by a Student t test (unpaired, two-tailed) or a two-way ANOVA with a post hoc test.