. 2021 Nov 22;82(2):264–277. doi: 10.1158/0008-5472.CAN-21-1171

Figure 3.

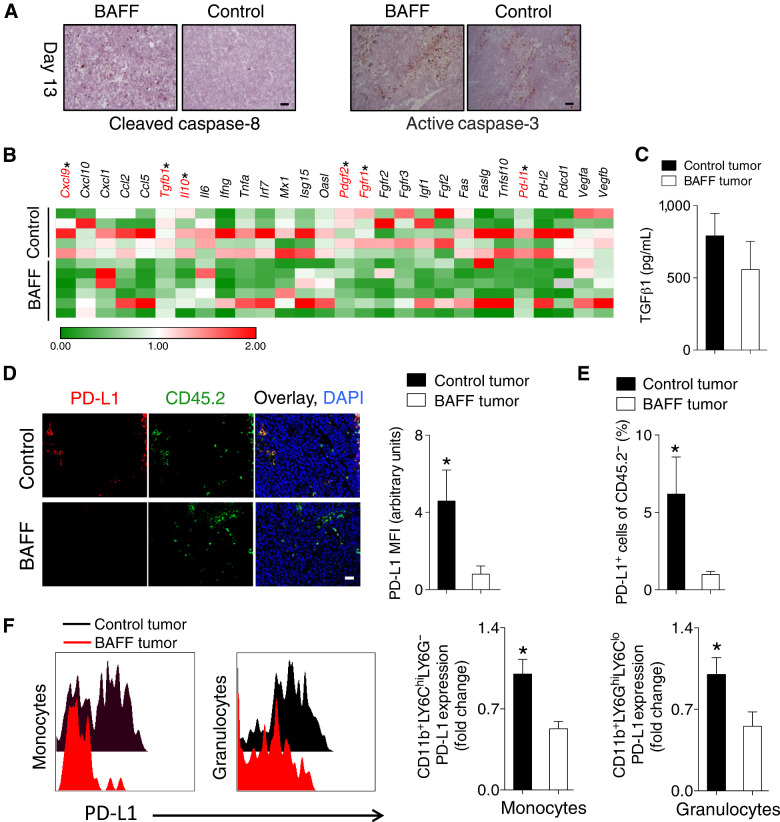
Figure 3. BAFF tumors are characterized by increased apoptosis and decreased immunosuppressive factors including PD-L1. A–F, C57BL/6 mice were inoculated subcutaneously with 5 × 10⁵ of BAFF-expressing or control cells and tumors were analyzed as indicated at day 13. A, Tumor apoptosis was assessed using conventional IHC staining for active caspase-3 and cleaved caspase-8 (representative images of n = 3–4 mice are shown). Scale bar, 50 μm. B, Gene expression level of various factors was determined in whole tumors. Expression was normalized to Gapdh and then to control tumors within each independent experiment (n = 5–6, pooled from two independent in vivo experiments). C, The levels of soluble TGFβ1 protein in tumors were determined using ELISA (n = 6–8, pooled from two independent in vivo experiments). D, PD-L1 protein expression in tumors was assessed using fluorescent IHC (a representative image of n = 5–6 mice from two independent experiments is shown; left) and quantified (right). E, Percent of PD-L1–positive CD45.2− cells in tumors was assessed using FACS (n = 9–10, pooled from three independent in vivo experiments). F, PD-L1 expression was measured on monocytes and granulocytes using FACS (n = 9–10, pooled from three independent in vivo experiments). All scale bars indicate 50 μm. Error bars in all experiments indicate SEM. *, P < 0.05 as determined by a Student t test (unpaired, two-tailed).

BAFF tumors are characterized by increased apoptosis and decreased immunosuppressive factors including PD-L1. A–F, C57BL/6 mice were inoculated subcutaneously with 5 × 10⁵ of BAFF-expressing or control cells and tumors were analyzed as indicated at day 13. A, Tumor apoptosis was assessed using conventional IHC staining for active caspase-3 and cleaved caspase-8 (representative images of n = 3–4 mice are shown). Scale bar, 50 μm. B, Gene expression level of various factors was determined in whole tumors. Expression was normalized to Gapdh and then to control tumors within each independent experiment (n = 5–6, pooled from two independent in vivo experiments). C, The levels of soluble TGFβ1 protein in tumors were determined using ELISA (n = 6–8, pooled from two independent in vivo experiments). D, PD-L1 protein expression in tumors was assessed using fluorescent IHC (a representative image of n = 5–6 mice from two independent experiments is shown; left) and quantified (right). E, Percent of PD-L1–positive CD45.2 cells in tumors was assessed using FACS (n = 9–10, pooled from three independent in vivo experiments). F, PD-L1 expression was measured on monocytes and granulocytes using FACS (n = 9–10, pooled from three independent in vivo experiments). All scale bars indicate 50 μm. Error bars in all experiments indicate SEM. *, P < 0.05 as determined by a Student t test (unpaired, two-tailed).