. 2021 Nov 9;82(2):292–306. doi: 10.1158/0008-5472.CAN-20-2426

Figure 4.

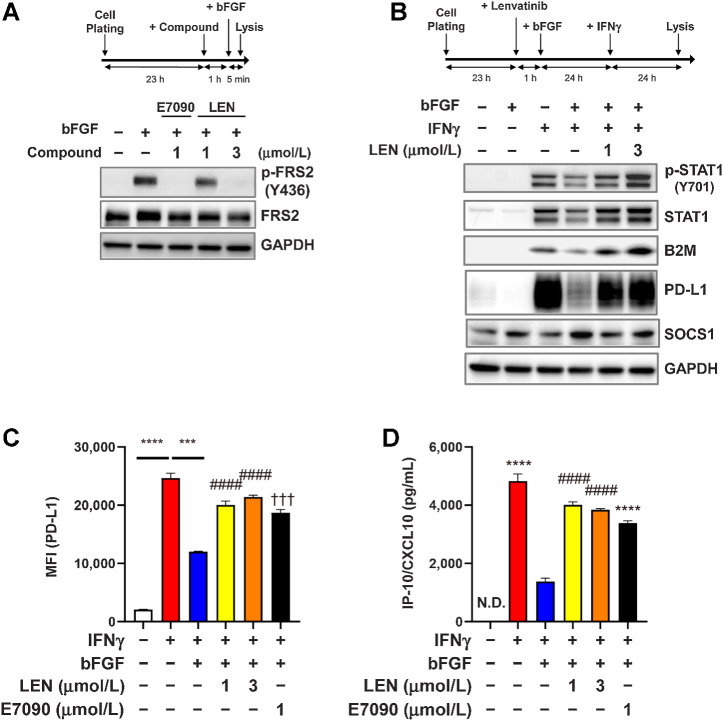
Figure 4. Inhibitory effect of FGFR signaling on IFNγ-signaling pathways in RAG cells. A and B. Experimental schemes (top) and Western blot analysis using the indicated antibodies (bottom). The housekeeping molecule GAPDH was used as a loading control. A, Effects of lenvatinib and E7090 on the FGFR-signaling pathway. RAG cells were treated first with lenvatinib at 1 or 3 μmol/L or with E7090 at 1 μmol/L for 1 hour and then treated with bFGF 10 ng/mL for 5 minutes. B, Effects of FGFR signaling on the IFNγ-signaling pathway. RAG cells were treated first with lenvatinib at 1 or 3 μmol/L for 1 hour and then with bFGF 10 ng/mL for 23 hours. After those treatments, cells were stimulated with IFNγ 5 ng/mL for 24 hours. C, Effects of FGFR signaling on expression levels of IFNγ-induced cell surface PD-L1. RAG cells were treated first with lenvatinib at 1 or 3 μmol/L or with E7090 at 1 μmol/L for 1 hour, after which, all cells were treated with bFGF 10 ng/mL for 23 hours and then stimulated with IFNγ 5 ng/mL for 24 hours. Cell surface expression level of PD-L1 was analyzed by using flow cytometry. Data are presented as means + SEM (n = 3). ***, P < 0.001; ****, P < 0.0001, unpaired t test between groups. ####, P < 0.0001, Dunnett multiple comparison test versus bFGF+IFNγ-treated group (blue bar). †††, P < 0.001, unpaired t test versus bFGF+IFNγ-treated group (blue bar). D, Effects of FGFR signaling on expression levels of IFNγ-induced CXCL10 in culture supernatant. RAG cells were treated as same as C. CXCL10 levels in culture supernatants were analyzed through ELISA. Data are presented as means + SEM (n = 4). ****, P < 0.0001, unpaired t test versus bFGF+IFNγ-treated group (blue bar). ####, P < 0.0001, Dunnett multiple comparison test versus bFGF+IFNγ-treated group (blue bar). LEN, lenvatinib; N.D., not determined (i.e., below the lower limit of detection).

Inhibitory effect of FGFR signaling on IFNγ-signaling pathways in RAG cells. A and B. Experimental schemes (top) and Western blot analysis using the indicated antibodies (bottom). The housekeeping molecule GAPDH was used as a loading control. A, Effects of lenvatinib and E7090 on the FGFR-signaling pathway. RAG cells were treated first with lenvatinib at 1 or 3 μmol/L or with E7090 at 1 μmol/L for 1 hour and then treated with bFGF 10 ng/mL for 5 minutes. B, Effects of FGFR signaling on the IFNγ-signaling pathway. RAG cells were treated first with lenvatinib at 1 or 3 μmol/L for 1 hour and then with bFGF 10 ng/mL for 23 hours. After those treatments, cells were stimulated with IFNγ 5 ng/mL for 24 hours. C, Effects of FGFR signaling on expression levels of IFNγ-induced cell surface PD-L1. RAG cells were treated first with lenvatinib at 1 or 3 μmol/L or with E7090 at 1 μmol/L for 1 hour, after which, all cells were treated with bFGF 10 ng/mL for 23 hours and then stimulated with IFNγ 5 ng/mL for 24 hours. Cell surface expression level of PD-L1 was analyzed by using flow cytometry. Data are presented as means + SEM (n = 3). ***, P < 0.001; ****, P < 0.0001, unpaired t test between groups. ####, P < 0.0001, Dunnett multiple comparison test versus bFGF+IFNγ-treated group (blue bar). †††, P < 0.001, unpaired t test versus bFGF+IFNγ-treated group (blue bar). D, Effects of FGFR signaling on expression levels of IFNγ-induced CXCL10 in culture supernatant. RAG cells were treated as same as C. CXCL10 levels in culture supernatants were analyzed through ELISA. Data are presented as means + SEM (n = 4). ****, P < 0.0001, unpaired t test versus bFGF+IFNγ-treated group (blue bar). ####, P < 0.0001, Dunnett multiple comparison test versus bFGF+IFNγ-treated group (blue bar). LEN, lenvatinib; N.D., not determined (i.e., below the lower limit of detection).