. 2021 Nov 9;82(2):292–306. doi: 10.1158/0008-5472.CAN-20-2426

Figure 5.

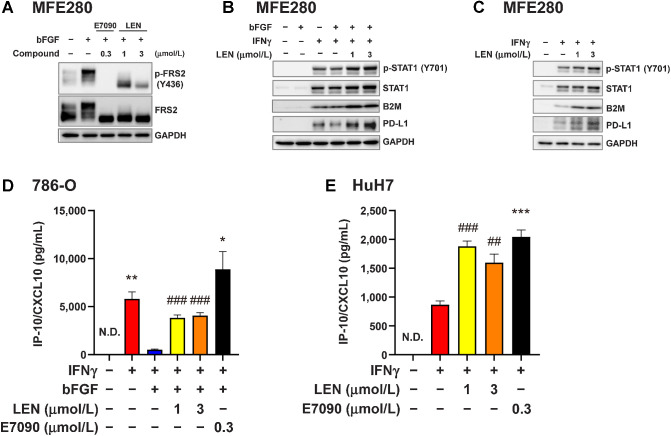
Figure 5. Inhibitory effect of FGFR signaling on the IFNγ signaling pathway in human cancer cells. A–C, Western blot analysis in MFE280 human endometrial cancer cells using the indicated antibodies; GAPDH was included as a loading control. A, MFE280 cells were starved in medium containing 0.1% FBS for 18 hours, and then treated first with lenvatinib at 1 or 3 μmol/L or with E7090 at 0.3 μmol/L for 1 hour and finally with bFGF (10 ng/mL) for 5 minutes. B, MFE280 cells were pretreated with lenvatinib at 1 or 3 μmol/L for 1 hour and then treated with bFGF (10 ng/mL) for 23 hours. Finally, cells were stimulated with IFNγ (5 ng/mL) for 24 hours. C, MFE280 cells were treated with lenvatinib at 1 or 3 μmol/L for 24 hours and then stimulated with IFNγ (5 ng/mL) for 24 hours. D and E, CXCL10 levels in culture supernatants were analyzed by ELISA. Data are presented as means + SEM of three independent experiments. D, Human renal cell carcinoma 786-O cells were treated first with lenvatinib at 1 or 3 μmol/L or with E7090 at 0.3 μmol/L for 1 hour and then with bFGF (10 ng/mL) for 23 hours. Finally, cells were stimulated with IFNγ (5 ng/mL) for 24 hours. *, P < 0.05; **, P < 0.01, unpaired t test versus bFGF+IFNγ-treated group (blue bar); ###, P < 0.001, Dunnett multiple-comparison test versus bFGF+IFNγ-treated group (blue bar). E, Human hepatocellular carcinoma HuH7 cells were treated first with lenvatinib at 1 or 3 μmol/L or with E7090 at 0.3 μmol/L for 24 hours and then stimulated with IFNγ (5 ng/mL) for 24 hours. ***, P < 0.001, unpaired t test versus IFNγ-treated group (red bar). ##, P < 0.01; ###, P < 0.001, Dunnett multiple comparison test versus IFNγ-treated group (red bar). LEN, lenvatinib; N.D., not determined (i.e., below the lower limit of detection).

Inhibitory effect of FGFR signaling on the IFNγ signaling pathway in human cancer cells. A–C, Western blot analysis in MFE280 human endometrial cancer cells using the indicated antibodies; GAPDH was included as a loading control. A, MFE280 cells were starved in medium containing 0.1% FBS for 18 hours, and then treated first with lenvatinib at 1 or 3 μmol/L or with E7090 at 0.3 μmol/L for 1 hour and finally with bFGF (10 ng/mL) for 5 minutes. B, MFE280 cells were pretreated with lenvatinib at 1 or 3 μmol/L for 1 hour and then treated with bFGF (10 ng/mL) for 23 hours. Finally, cells were stimulated with IFNγ (5 ng/mL) for 24 hours. C, MFE280 cells were treated with lenvatinib at 1 or 3 μmol/L for 24 hours and then stimulated with IFNγ (5 ng/mL) for 24 hours. D and E, CXCL10 levels in culture supernatants were analyzed by ELISA. Data are presented as means + SEM of three independent experiments. D, Human renal cell carcinoma 786-O cells were treated first with lenvatinib at 1 or 3 μmol/L or with E7090 at 0.3 μmol/L for 1 hour and then with bFGF (10 ng/mL) for 23 hours. Finally, cells were stimulated with IFNγ (5 ng/mL) for 24 hours. *, P < 0.05; **, P < 0.01, unpaired t test versus bFGF+IFNγ-treated group (blue bar); ###, P < 0.001, Dunnett multiple-comparison test versus bFGF+IFNγ-treated group (blue bar). E, Human hepatocellular carcinoma HuH7 cells were treated first with lenvatinib at 1 or 3 μmol/L or with E7090 at 0.3 μmol/L for 24 hours and then stimulated with IFNγ (5 ng/mL) for 24 hours. ***, P < 0.001, unpaired t test versus IFNγ-treated group (red bar). ##, P < 0.01; ###, P < 0.001, Dunnett multiple comparison test versus IFNγ-treated group (red bar). LEN, lenvatinib; N.D., not determined (i.e., below the lower limit of detection).