Figure 3.
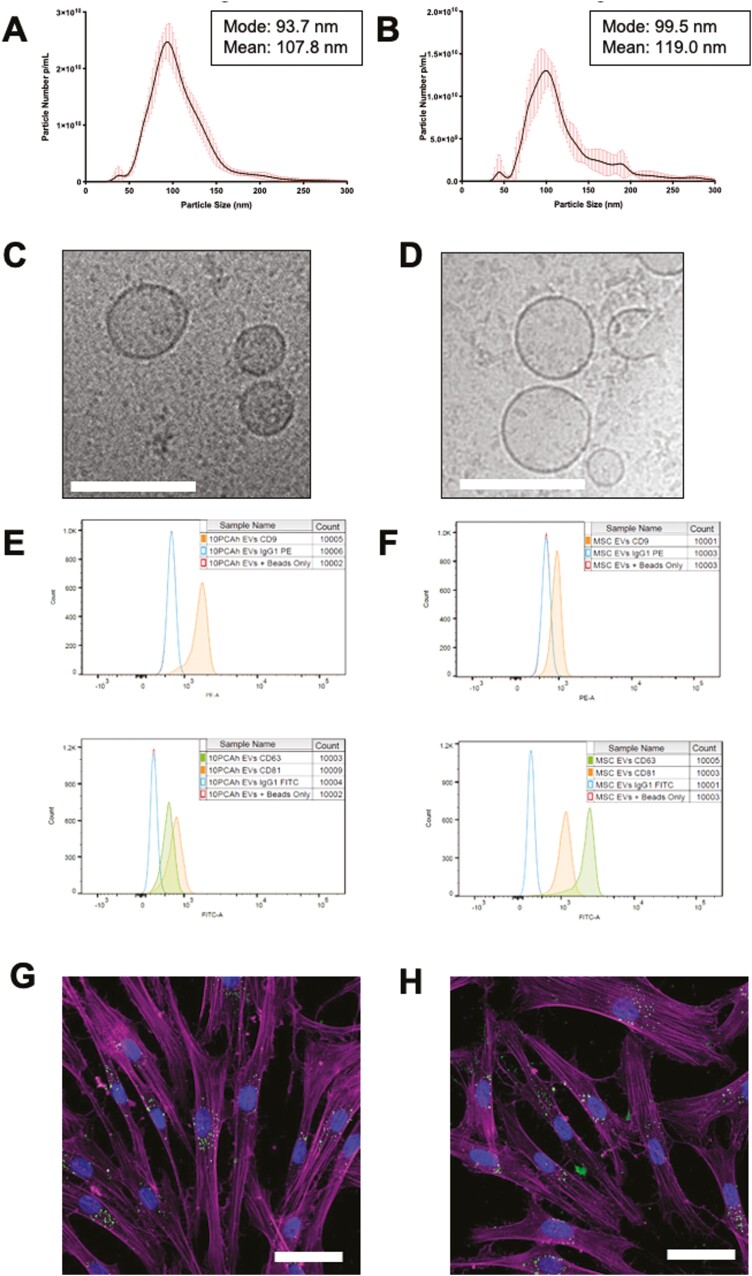
sEV characterization by both NTA (data from 6 technical repeats) and Cryo-EM demonstrated particles of the expected size for sEVs for both OMLP-PCL (A&C) and MSCs (B&D; Scale bar = 100 nm). Tetraspannin expression was determined by flow cytometry and demonstrated OMLP-PCL sEVs (E) and MSC sEVS (F) were positive for CD9, CD81, and CD63. Fluorescently labeled sEVs (Green-488) from OMLP-PCL (G) and MSCs (H) demonstrated uptake into dermal fibroblasts which were counterstained to visualize actin (Magenta) and the cell nucleus (Blue)—images are confocal slices. Scale bar = 50 μm. Error bars for NTA = SD.

